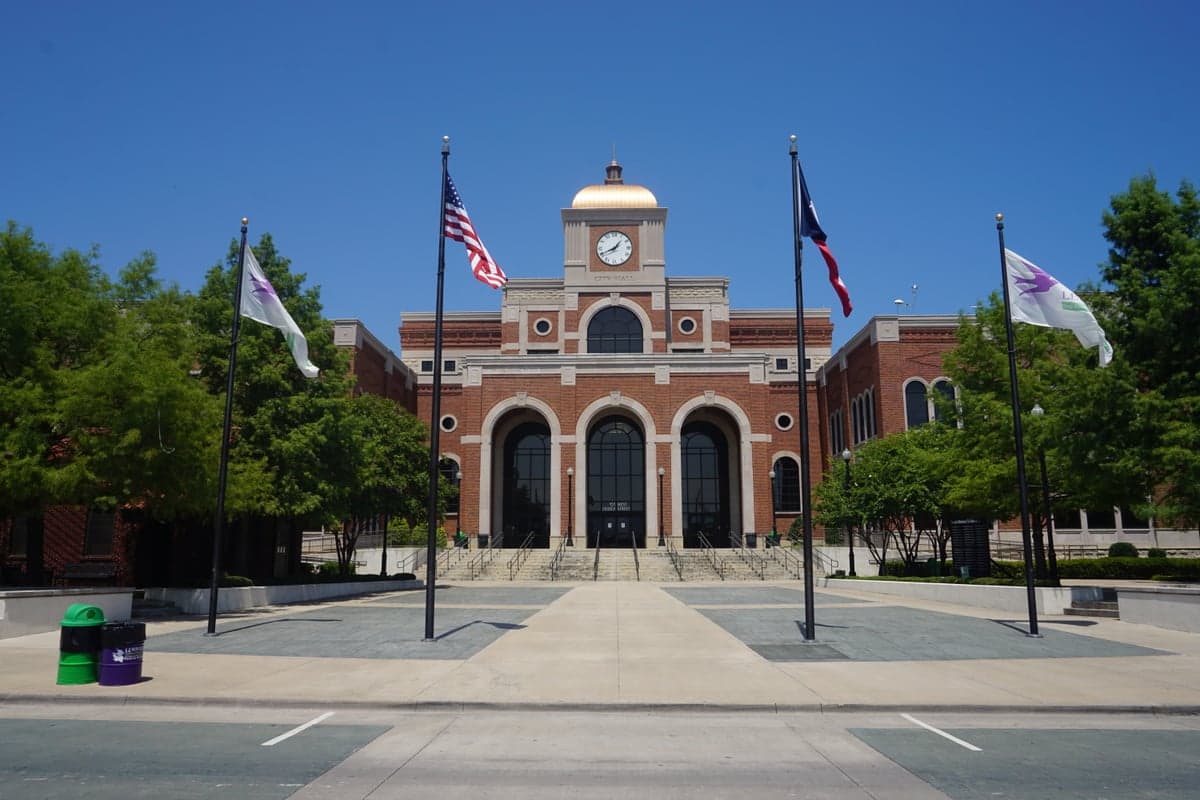
Photo: Wikipedia
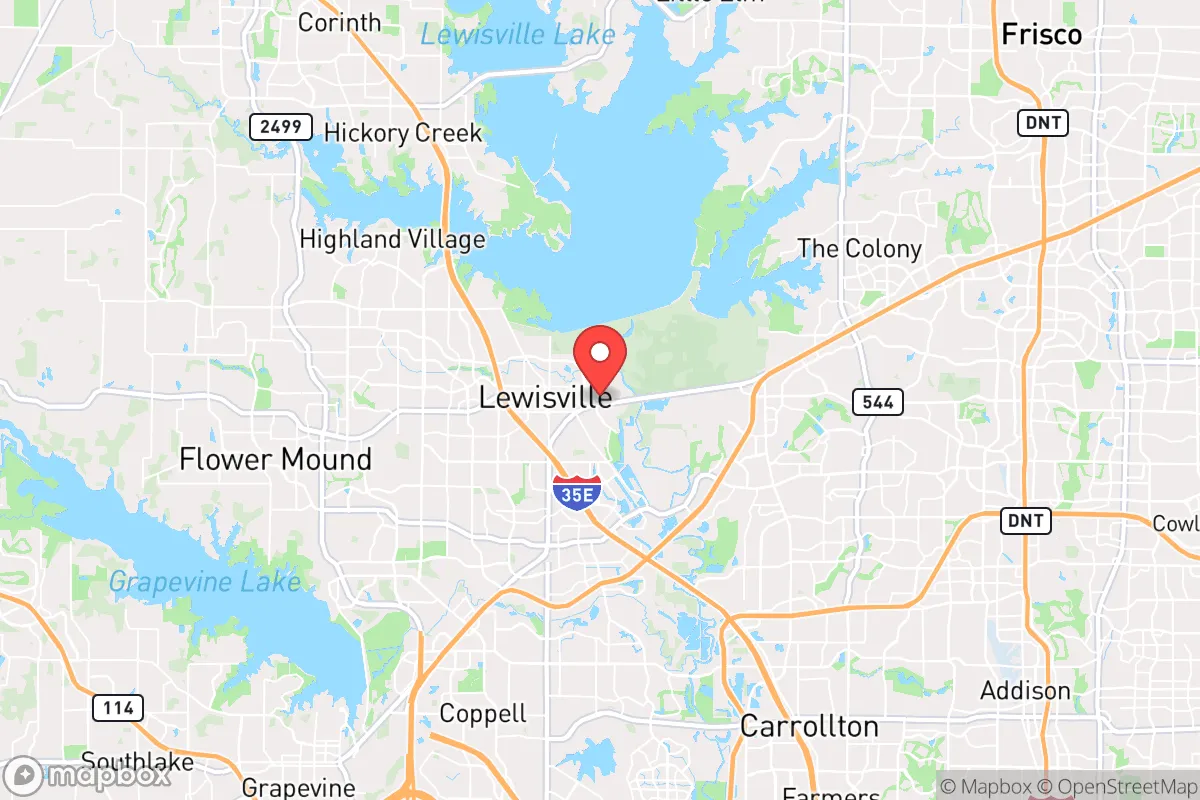
Demographics of Lewisville, TX
Affluence Level in Lewisville, TX
A middle-class area roughly in line with national averages across income, home values, education, and employment.
People of Lewisville, TX
Lewisville, Texas, is home to 128,313 residents, making it one of the most ethnically diverse mid-sized cities in the Dallas-Fort Worth metroplex. The city’s population is characterized by a near-even split between non-Hispanic white residents (39.0%) and a combined majority of Hispanic (29.3%), Black (13.4%), East/Southeast Asian (8.0%), and Indian subcontinent (5.8%) communities. With 13.2% foreign-born and 39.4% college-educated, Lewisville is a working-to-middle-class suburb where distinct ethnic enclaves and mixed-income neighborhoods coexist within a compact, 40-square-mile footprint.
How the city was settled and grew
Lewisville’s human history begins with its 1840s founding as a farming and cotton-ginning settlement on the Elm Fork of the Trinity River. The original white settlers were primarily Anglo-American families from Tennessee, Kentucky, and Missouri, drawn by the Republic of Texas land grants. The arrival of the Dallas-Wichita Railroad in 1881 transformed the hamlet into a regional shipping point for cotton and grain, attracting a small number of German and Czech immigrant farmers who settled in what is now the Old Town Lewisville district, centered around Main Street and Poydras Street. Through the early 20th century, the population remained overwhelmingly white and native-born, reaching roughly 4,000 by 1950. The construction of Lewisville Lake (completed 1955) and the opening of Interstate 35E in the 1960s triggered the first major suburban wave: white middle-class families from Dallas moved into new subdivisions like Valley Ridge and Lake Park Estates, drawn by affordable ranch-style homes and the promise of lakefront recreation.
Modern era (post-1965)
The post-1965 Immigration and Nationality Act reshaped Lewisville’s population more dramatically than any earlier event. The first significant non-white arrivals were Vietnamese and Korean families in the 1970s and 1980s, many of whom were refugees or secondary migrants from Houston and Dallas. They clustered along the Fox Avenue corridor and around the intersection of Round Grove Road and I-35E, establishing small grocery stores and churches that anchor the city’s East/Southeast Asian community today (8.0% of the population). The 1990s and 2000s brought a second wave: Mexican and Central American immigrants, drawn by construction and service jobs in the booming DFW economy, settled heavily in the Westside neighborhoods west of I-35E, particularly around Southwest Parkway and Bellaire Boulevard. This area now has the highest Hispanic concentration in the city (approaching 50% in some census tracts). Simultaneously, Black families—many relocating from southern Dallas and Oak Cliff—moved into the Hedgcoxe and College Street areas east of I-35E, where affordable 1970s-era apartments and starter homes offered a suburban alternative to the city. The most recent major inflow, beginning around 2010, has been Indian subcontinent professionals (5.8% of the population), employed in the telecom and IT sectors of nearby Plano and Richardson. They have concentrated in newer, higher-density developments near the Lewisville Lake Toll Bridge and the eastern edge of the city, particularly in the Lakebridge and Twin Creeks subdivisions, where larger homes and top-rated school zones (like those serving Lewisville High School’s Harmon Campus) are located.
The future
Lewisville’s demographic trajectory points toward continued diversification and a gradual shift from a white-majority to a plurality-minority city. The non-Hispanic white share has declined from roughly 55% in 2000 to 39% today, a trend that is likely to continue as older white residents age in place and younger, more diverse families move in. The Hispanic population is growing steadily through both immigration and natural increase, and is projected to approach 35-38% of the city by 2035, with the Westside becoming an even more solidly Hispanic corridor. The East/Southeast Asian community appears to be plateauing, as second-generation families often move to larger suburban homes in Frisco or McKinney. The Indian subcontinent population, however, is still in a growth phase, driven by H-1B visa holders and their families who find Lewisville’s housing prices more accessible than Plano or Coppell. The city is not tribalizing into hostile enclaves—most neighborhoods are mixed—but distinct ethnic concentrations are solidifying: Hispanic in the west, Black in the central-east, Indian in the northeast, and East/Southeast Asian in the south-central corridor. The overall population is expected to reach 140,000-145,000 by 2035, with growth concentrated in new multifamily developments near the Old Town transit center and along the I-35E frontage roads.
For a conservative-leaning individual or family moving to Lewisville today, the city offers a genuinely multiethnic, middle-class environment where no single group dominates and where traditional suburban amenities—good schools, low crime relative to Dallas, and lake access—remain intact. The population is becoming more diverse, more foreign-born, and slightly more college-educated each year, but the city’s character remains that of a pragmatic, family-oriented suburb rather than a progressive urban enclave. New arrivals should expect neighbors from a dozen different backgrounds and a civic culture that values stability over rapid change.
* Values derived from national, state, county, city and local statistics and may differ in a specific area. Last updated: 2026-04-21T13:19:09.000Z
Narrative content on this page is AI-generated and may contain mistakes. Verify any details that matter before acting on them.
ReloMaps may earn a commission from affiliate links at no extra cost to you.