Photo: Wikipedia
Demographics of Lovelock, NV
Affluence Level in Lovelock, NV
A low-income area with significant economic hardship. Household wealth and educational attainment are well below national averages.
People of Lovelock, NV
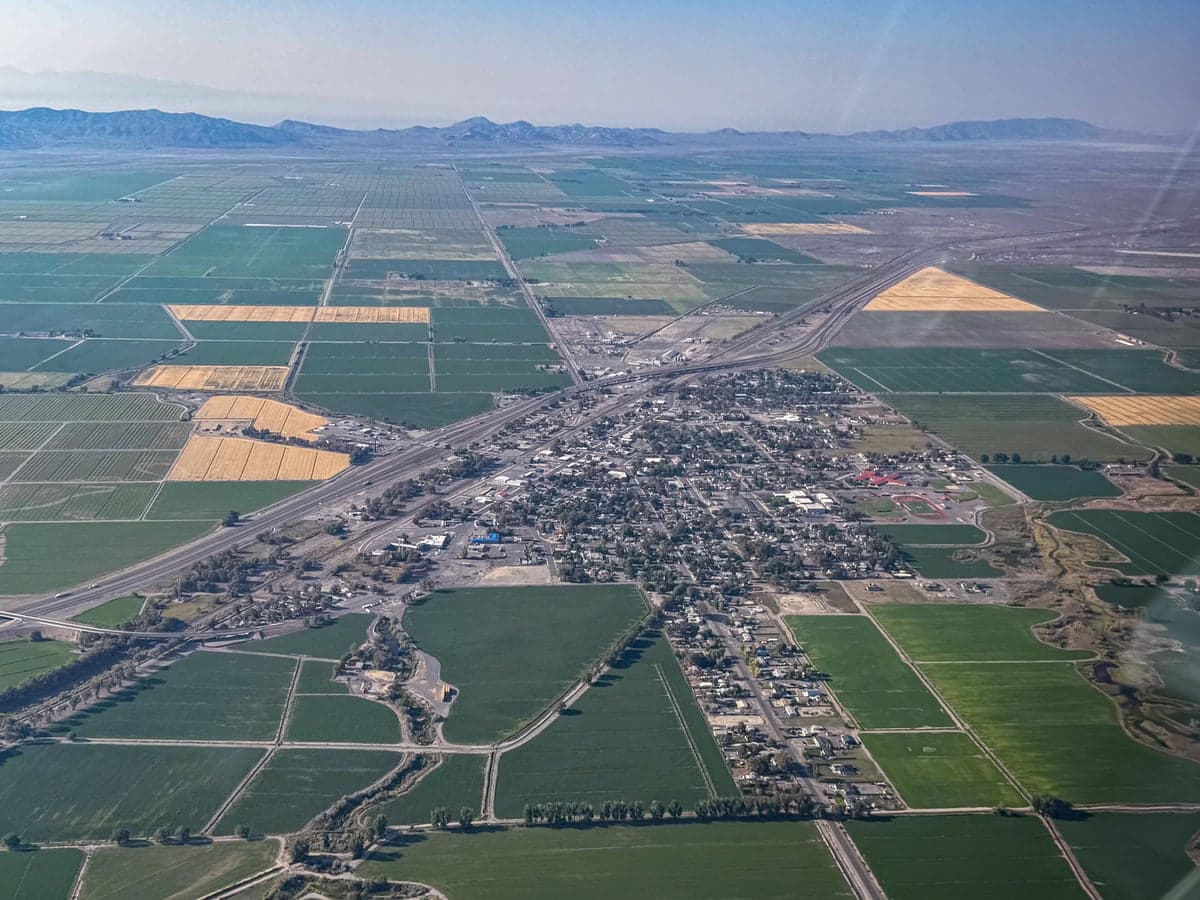
The people of Lovelock, Nevada, today number just 1,611, forming a tight-knit, predominantly working-class community with a distinctive rural Western character. The population is 55.6% White and 27.6% Hispanic, with small East/Southeast Asian (2.8%) and Black (0.6%) communities, and a notably low college attainment rate of 15.8%. This is a place where the past is still visible in the present—a railroad and agricultural hub where families have lived for generations, and where the demographic story is one of slow, steady change rather than rapid transformation.
How the city was settled and grew
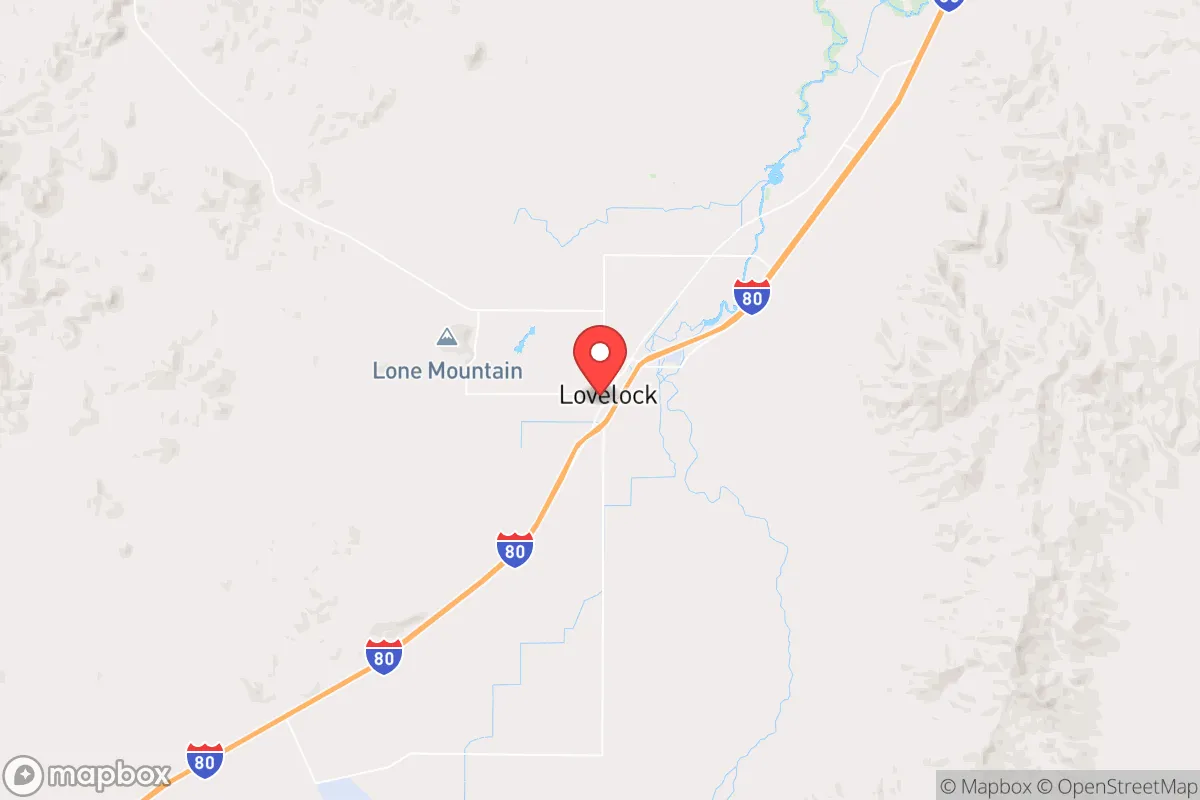
Lovelock’s human history begins with the Northern Paiute people, who inhabited the Humboldt Sink region for centuries before Euro-American contact. The city itself was founded in the 1860s as a station on the Central Pacific Railroad, named after George Lovelock, a local rancher. The original population was overwhelmingly White, drawn by the railroad and the promise of irrigated agriculture in the Humboldt River Valley. The first major wave of settlers were Anglo-American homesteaders and railroad workers, who built the Original Townsite—the historic core centered around Main Street and the railroad depot. By the early 1900s, a small but significant Chinese community had formed, working on the railroad and in local laundries and restaurants; their descendants are part of the 2.8% East/Southeast Asian population today. A second wave arrived during the 1930s and 1940s, when the New Deal’s Pershing County Water Conservation District projects expanded irrigation, drawing Dust Bowl migrants from Oklahoma and Texas. These families settled in the West Side neighborhood, near the agricultural fields, and their descendants remain a core part of the White population. The Hispanic presence began in the 1950s, when bracero programs and later family reunification brought Mexican farmworkers to the area; they initially concentrated in the South End, near the packing sheds and rail yards.
Modern era (post-1965)
The post-1965 era brought gradual demographic diversification, though Lovelock remained overwhelmingly White and rural. The Hart-Cellar Act of 1965 did not trigger a large wave of immigration here; instead, the foreign-born population today is just 5.6%, a figure that reflects the city’s limited economic opportunities. The Hispanic share grew steadily from the 1970s through the 2000s, as agricultural families in the South End and East Side (near the Humboldt River) expanded through higher birth rates and continued migration from Mexico. These neighborhoods today are predominantly Hispanic, with many families owning small homes on large lots. The White population, meanwhile, has aged and shrunk, with younger adults leaving for Reno or Las Vegas for jobs. The East/Southeast Asian community, primarily of Chinese and Filipino descent, has remained small and stable, concentrated in the Original Townsite and working in retail and services. The Black population (0.6%) is tiny and dispersed, with no distinct neighborhood concentration. The college-educated share of 15.8% is well below the national average, reflecting the city’s blue-collar economy of farming, mining, and the state prison (the Lovelock Correctional Center, which employs about 400 people).
The future
Lovelock’s population is heading toward a slow, gradual homogenization into a majority-Hispanic working-class community, with the White share declining and the Hispanic share rising. The city’s total population has been flat or slightly declining since the 1990s, as out-migration of young adults offsets natural increase. The Hispanic population is growing through higher fertility and some continued immigration, but the foreign-born share (5.6%) is not rising sharply, suggesting that growth is driven more by U.S.-born families than new arrivals. The East/Southeast Asian and Black communities are likely to remain small and stable, as there are no economic magnets drawing new migrants. The West Side and Original Townsite are aging and losing population, while the South End and East Side are becoming more densely Hispanic. Over the next 10–20 years, Lovelock will likely become a predominantly Hispanic city, with a White minority that is older and more rural in character. The city is not tribalizing into distinct enclaves—the small size and shared economy prevent that—but the demographic shift is real and will reshape local politics, schools, and community institutions.
For someone moving in now, Lovelock is a place where the past is still present: a railroad town becoming a Hispanic-majority agricultural community, with a quiet, stable character and limited economic dynamism. The population is friendly and self-reliant, but the low college attainment and flat job market mean that newcomers should expect a working-class lifestyle with few professional opportunities. The city’s future is one of gradual demographic change, not boom or bust—a place where families stay for generations, and where the next chapter will be written in Spanish as much as English.
* Values derived from national, state, county, city and local statistics and may differ in a specific area. Last updated: 2026-04-30T00:19:44.000Z
Narrative content on this page is AI-generated and may contain mistakes. Verify any details that matter before acting on them.
ReloMaps may earn a commission from affiliate links at no extra cost to you.