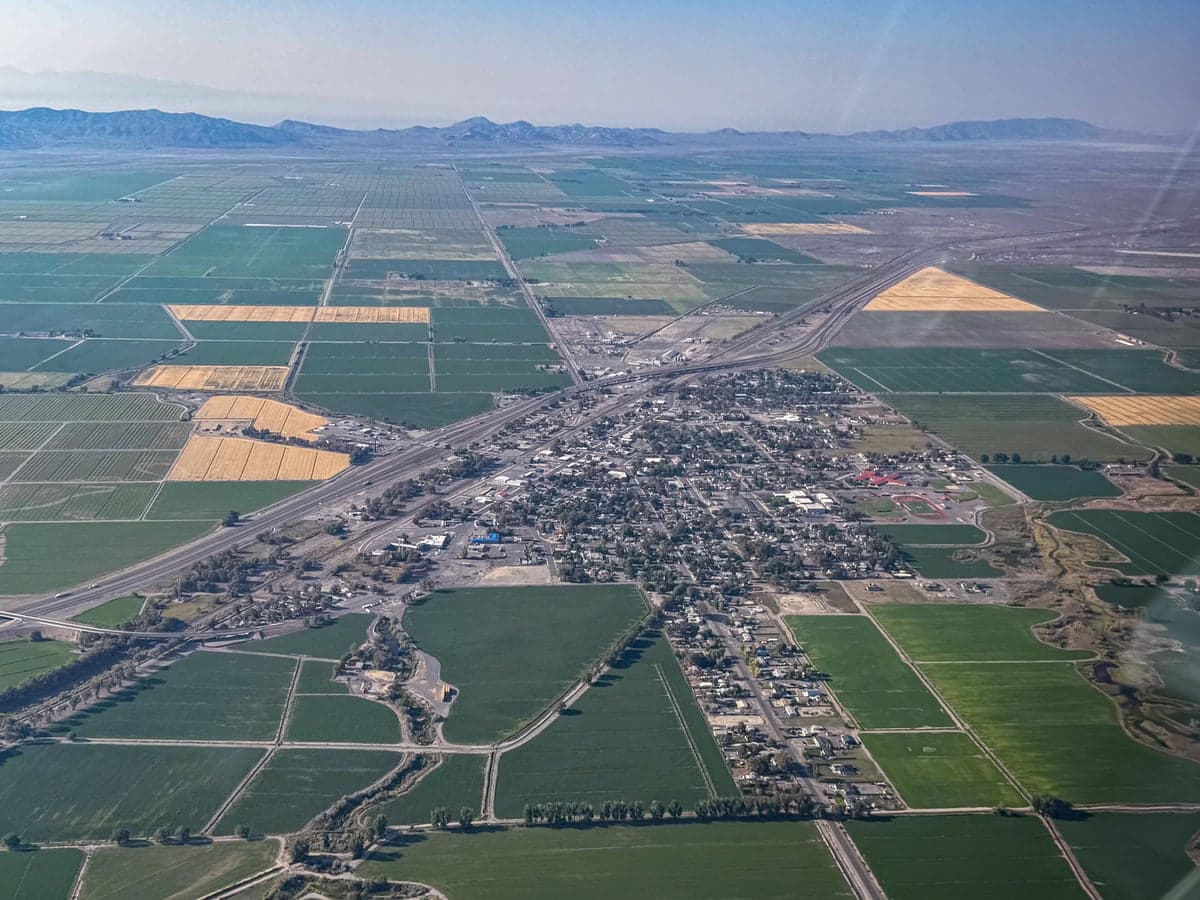
Photo: Wikipedia
Quality of Life in Lovelock, NV
Above-average quality of iife. The area offers a reasonable cost of living, decent mobility, and a mix of neighborhood amenities.
What does Quality of Life tell us?
Quality of Life blends cost of living, nearby amenities, socioeconomic signals, and neighborhood character. City-level scores represent the whole municipality; individual neighborhoods can differ.
What does this tell us?
Quality of Life blends cost of living, nearby amenities, socioeconomic signals, and neighborhood character. City-level scores represent the whole municipality; individual neighborhoods can differ.
Cost of Living
42% below national average
The Real Cost of Living in Lovelock, NV for 2026
| Tier | Individual | Family (4) |
|---|---|---|
| Survival | $11k | $21k |
| Comfortable | $29k | $43k |
| Luxury | $75k+ | $116k+ |
| Elite (Top 5%) | $99k+ | $154k+ |
97%
The Area Signal
A metric tracking the socioeconomic signals of the area.
Hobbies
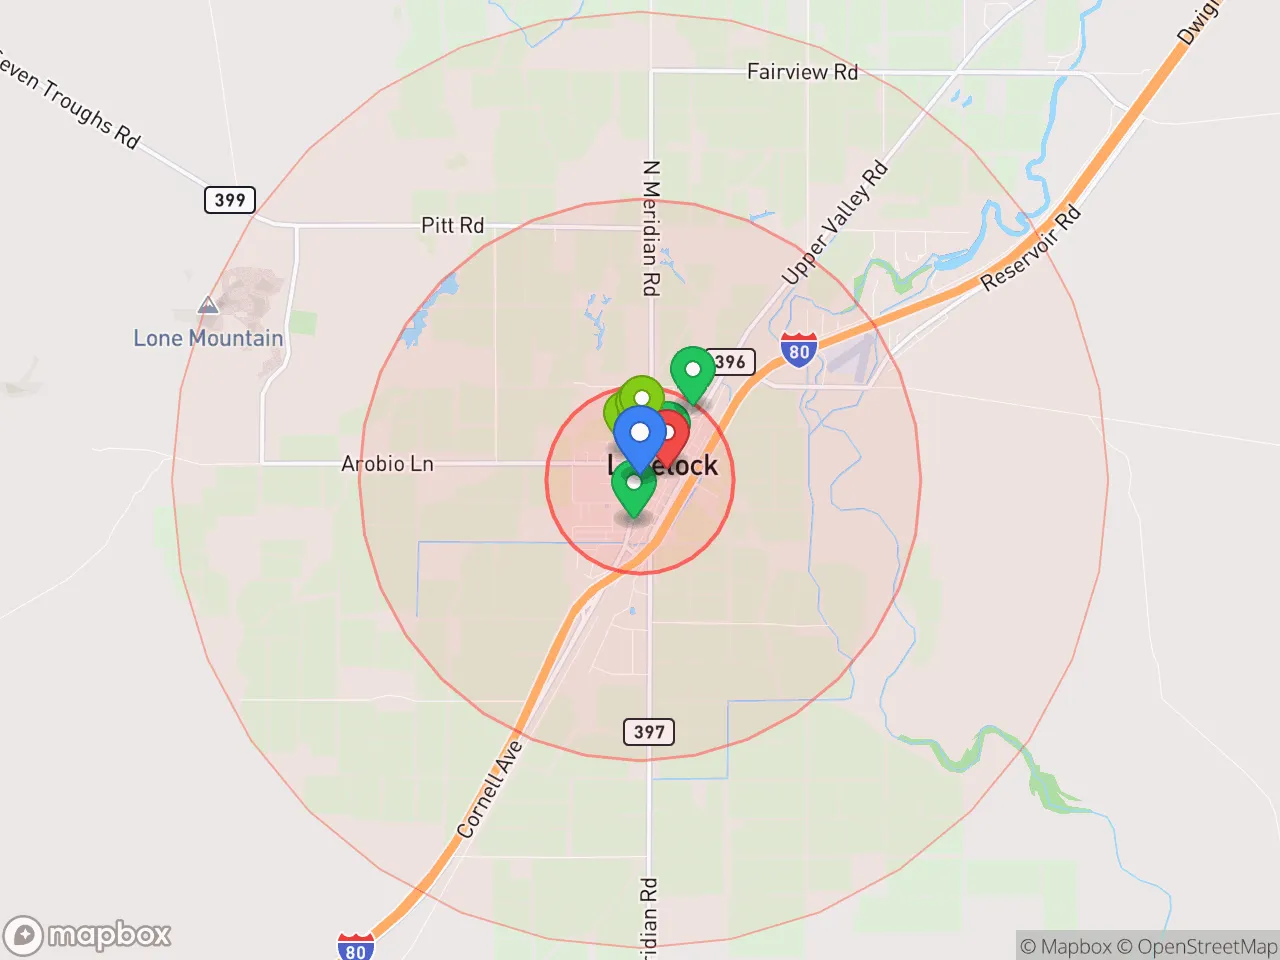
Explore the areaGroceries
1 within 10 miles
Gas
1 within 10 miles
Hospital
1 within 20 miles
Airport
SAN — Oakland San Francisco Bay
Post Office
USPS — Lovelock, NV
Critical Amenities
Quality-of-Life Analysis
Lovelock, Nevada, presents a notably affordable quality of life that attracts a mix of retirees, remote workers, and families seeking a slower pace in a rural setting. With a cost of living index of 58—42% below the U.S. average—the area’s median home value of $149,700 and median rent of $716 make it one of the most budget-friendly communities in Pershing County. The population skews older and more blue-collar than the state average, with a median age of 41.5 and a significant share of residents employed in agriculture, mining, and local government. While affluence is modest, the low financial pressure allows many to own homes outright and enjoy a debt-light lifestyle uncommon in pricier Nevada metros.
Cost of living, housing affordability, and how it compares to nearby areas
Lovelock’s cost of living index of 58 is dramatically lower than the national benchmark, and housing is the primary driver. The median home value of $149,700 is less than half the Nevada state median of roughly $400,000, and the median rent of $716 is about 60% of the Reno-Sparks average. For context, a comparable home in Fallon (60 miles south) would cost around $280,000, while in Winnemucca (70 miles east) the median exceeds $200,000. The average commute of 24.8 minutes reflects the area’s compact layout and limited traffic—most residents work within Pershing County or at the nearby I-80 corridor employers like the Lovelock Correctional Center or local farms. Property taxes are low, with an effective rate around 0.6%, and Nevada’s lack of state income tax further stretches household budgets. However, the trade-off is a limited housing stock: most homes are older single-family houses built before 1980, and rental vacancies are tight, often requiring direct outreach to landlords rather than online listings.
What daily life is like for families and retirees in Lovelock
Daily life in Lovelock revolves around a small downtown core along Cornell Avenue, anchored by the Pershing County Courthouse and a handful of local businesses like the Lovelock Mercantile. Groceries are available at the local Scolari’s, but for major shopping or medical specialists, residents drive 90 minutes to Reno or 70 minutes to Winnemucca. The Pershing County School District operates two elementary schools, one middle school, and Lovelock High School (enrollment ~200), with a student-teacher ratio of 15:1—smaller than the state average. Extracurriculars are limited but include 4-H, FFA, and youth rodeo, reflecting the agricultural character. For retirees, the Lovelock Senior Center offers daily meals and social activities, while outdoor enthusiasts use the nearby Humboldt River for fishing and the Rye Patch State Recreation Area for camping and boating. Healthcare is a notable gap: the Pershing General Hospital provides emergency and basic care, but specialists require travel, and the nearest Level II trauma center is in Reno. The pace is unhurried—most errands can be done in 15 minutes, and crime rates are low, with property crime about 30% below the national average.
Lovelock is best suited for those who prioritize affordability and quiet over convenience and variety. Remote workers with stable internet (Lovelock has fiber in parts of town) can leverage the low cost of living to save aggressively, while retirees on fixed incomes will find their dollars stretch further here than in any Nevada metro. Families should weigh the small-school benefits against the limited extracurriculars and healthcare access. For anyone seeking a low-stress, low-cost base with genuine rural character—and who doesn’t mind a long drive for a Costco run—Lovelock delivers a quality of life that is both practical and peaceful.
Crime in Lovelock, NV
Higher crime rates than 57% of comparable U.S. locations.
Violent CrimeViolent Crime Analysis
Property CrimeProperty Crime Analysis
Crime Analysis
Lovelock, Nevada, presents a mixed safety profile that demands careful consideration from potential residents. With a violent crime rate of 371.5 per 100,000 residents and a property crime rate of 1,977.7 per 100,000, the small town of roughly 1,900 people faces challenges that exceed national averages. These figures place Lovelock in a position where understanding local law enforcement capacity and judicial philosophy is essential for anyone evaluating relocation to Pershing County.
Crime in context
Lovelock’s violent crime rate of 371.5 per 100,000 is roughly double the national average of 380 per 100,000, though it sits below Nevada’s statewide rate of approximately 440 per 100,000. Property crime in Lovelock, at 1,977.7 per 100,000, is about 40% higher than the national average of 1,954 per 100,000 and significantly above the Nevada state average of roughly 1,800 per 100,000. These numbers indicate that while violent incidents are less frequent than in larger Nevada cities like Reno or Las Vegas, property offenses—particularly theft and burglary—are a persistent concern. The town’s remote location along Interstate 80, with limited state police presence, may contribute to these elevated rates, as transient populations and drug-related activity often impact rural communities along major highways.
What residents experience
Daily life in Lovelock involves a heightened awareness of property crime. Residents commonly report vehicle break-ins, shed burglaries, and theft of outdoor equipment. The violent crime rate, while lower than in urban centers, is still a concern given the town’s small population—meaning a single incident can feel disproportionately impactful. Lovelock is not part of a large metro area with progressive prosecutors; Pershing County’s District Attorney’s office operates under a more traditional, law-and-order framework. This is a positive factor for safety-conscious readers, as it suggests a judicial environment less likely to prioritize offender rehabilitation over public protection. However, the town’s limited police force (typically fewer than 10 officers) means response times can be slower, and proactive patrols are less frequent than in larger jurisdictions.
Neighborhood-level variation
Crime in Lovelock is not evenly distributed. The historic downtown core and areas near the Interstate 80 exits see higher rates of property crime, likely due to transient traffic and commercial activity. Residential neighborhoods east of the railroad tracks, particularly around Marzen Lane and the older subdivisions near the Pershing County Courthouse, tend to report fewer incidents. The most secure areas are the newer subdivisions on the town’s western edge, where home values are higher and community watch efforts are more organized. Prospective residents should prioritize properties with off-street parking, secure fencing, and good exterior lighting, as these features correlate with lower victimization rates in Lovelock’s environment. Overall, while Lovelock is not a high-crime area by national standards, its elevated property crime rate and limited law enforcement resources mean that personal security measures are a practical necessity rather than an optional precaution.
* Values derived from national, state, county, city and local statistics and may differ in a specific area. Last updated: 2026-04-30T00:19:44.000Z
Narrative content on this page is AI-generated and may contain mistakes. Verify any details that matter before acting on them.
ReloMaps may earn a commission from affiliate links at no extra cost to you.