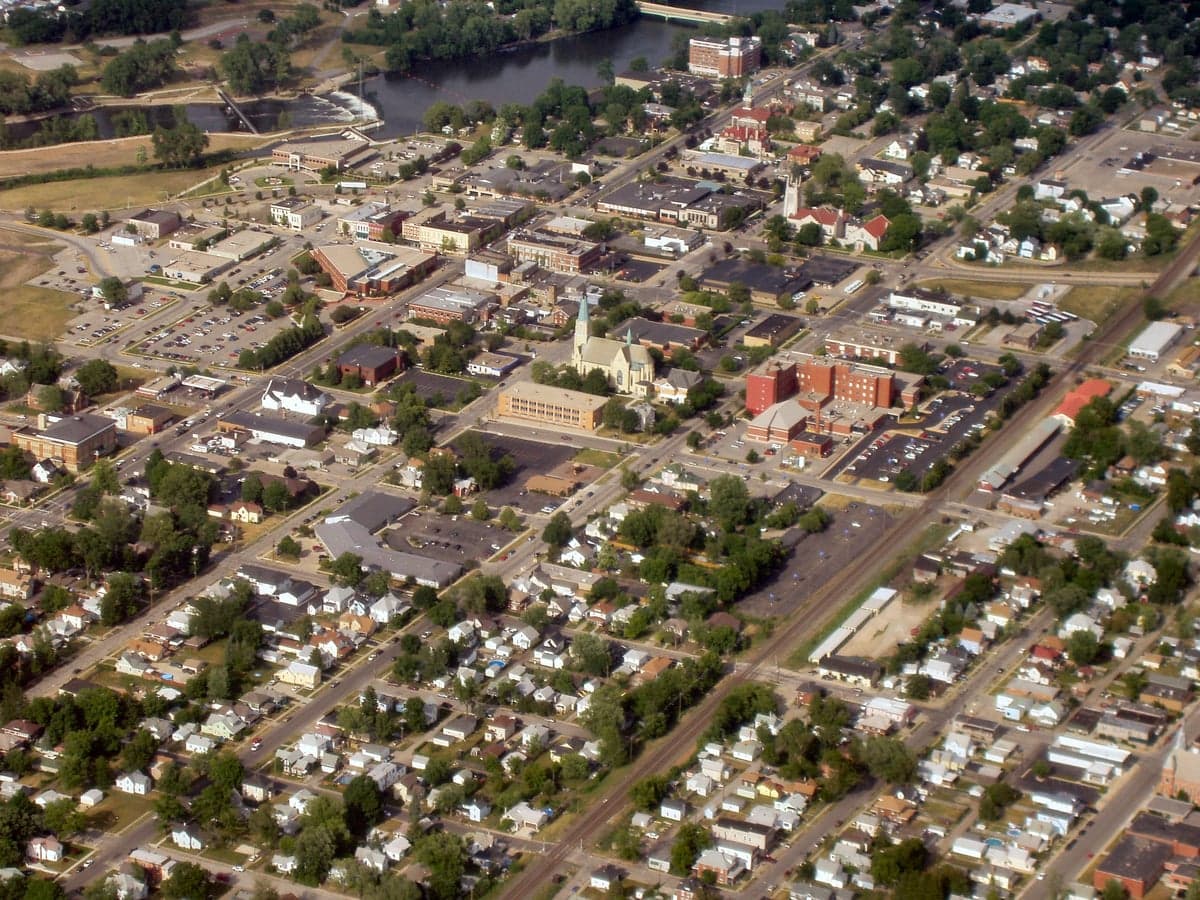
Photo: Wikipedia
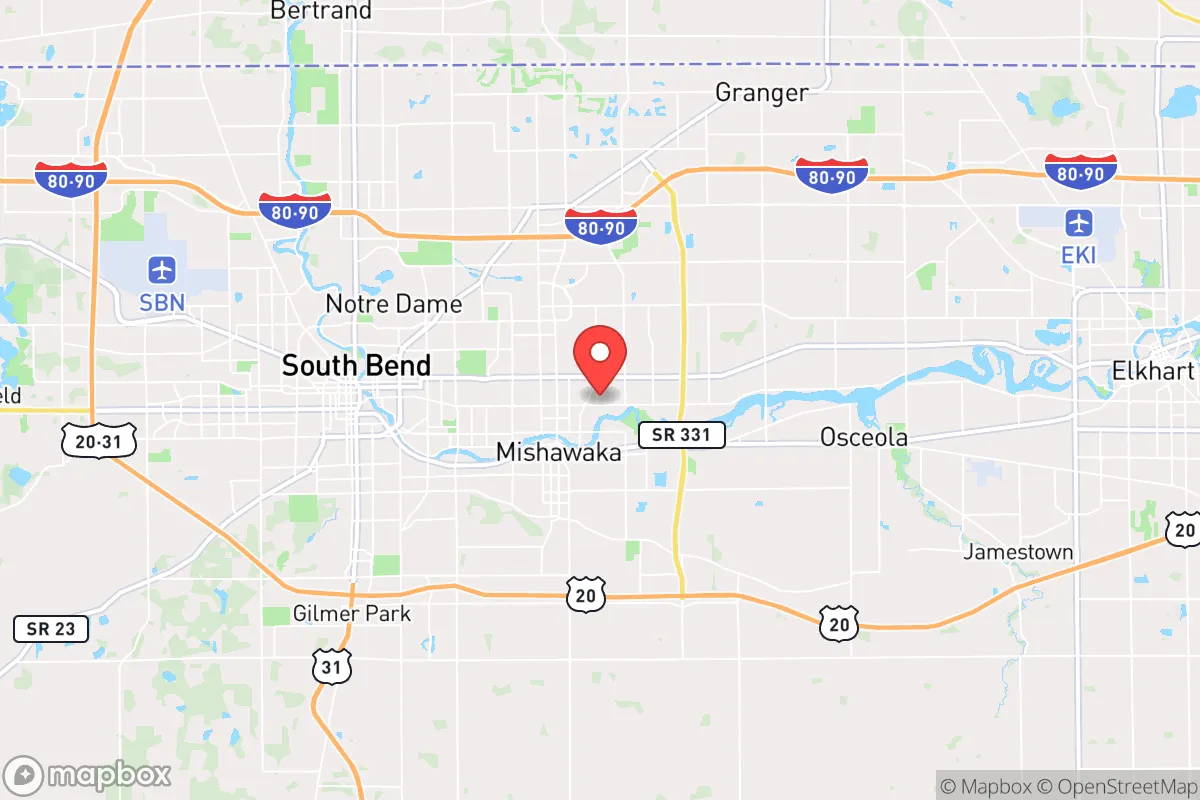
Demographics of Mishawaka, IN
Affluence Level in Mishawaka, IN
A below-average socioeconomic profile. Incomes, home values, and educational attainment trail the U.S., with higher poverty and unemployment.
People of Mishawaka, IN
The people of Mishawaka, Indiana, today number 50,907, forming a predominantly white (75.6%) working- and middle-class city with a modest but growing diversity. The city’s identity is rooted in its industrial past—a manufacturing hub that drew successive waves of European immigrants and, later, domestic migrants from the Rust Belt and the South. Mishawaka remains denser and more blue-collar than its neighbor South Bend, with a distinctive pride in its riverfront and historic neighborhoods, though it faces the demographic challenges of an aging population and a college attainment rate (27.9%) below the national average.
How the city was settled and grew
Mishawaka’s population history begins with the Potawatomi people, who occupied the St. Joseph River valley before forced removal in the 1830s. Euro-American settlement accelerated after 1831, when the town was platted around the river’s waterpower. The original settlers were Yankees from New England and upstate New York, drawn by timber and the potential for mills. By the 1850s, the arrival of the Michigan Southern Railroad turned Mishawaka into a manufacturing center, and the first major immigrant wave—Irish laborers—built the railroad and worked in the early mills, settling in what is now the Eastside neighborhood along the river. A second wave of German immigrants arrived after the Civil War, establishing themselves as skilled tradesmen and shopkeepers in the Central Park area, where many of their descendants still live. The city’s industrial boom peaked in the early 20th century with the rise of the Mishawaka Rubber & Woolen Manufacturing Company (later Uniroyal), which employed thousands. This drew a third wave: Polish, Hungarian, and Slovak immigrants who clustered in the West End and Battell Park neighborhoods, building Catholic parishes and ethnic social clubs that persisted for generations. By 1950, Mishawaka’s population had reached roughly 30,000, overwhelmingly white and European-ethnic, with a strong unionized manufacturing base.
Modern era (post-1965)
The post-1965 era brought significant demographic change, though Mishawaka remained less diverse than the national average. The 1965 Hart-Cellar Act opened immigration from Asia and Latin America, but Mishawaka’s draw was limited compared to larger cities. The most notable shift was domestic: as the Uniroyal plant and other factories downsized in the 1970s and 1980s, white families began moving to newer suburbs like Granger (an unincorporated area north of the city), while Black families from South Bend and the broader Rust Belt moved into Mishawaka’s Eastside and Lincoln Park neighborhoods, seeking affordable housing. By 2020, the Black population had grown to 8.9%, concentrated in these older, lower-cost areas. The Hispanic population (6.4%) is a more recent arrival, primarily Mexican and Central American immigrants drawn to construction, service, and light manufacturing jobs; they have settled in the West End and along the Main Street corridor. East/Southeast Asian residents (2.0%) are a smaller but visible group, many connected to the University of Notre Dame and local healthcare, living in the Battell Park and Merrifield Park areas. The Indian-subcontinent population (0.6%) is similarly small and professional, often commuting to South Bend or Elkhart for tech and medical jobs. The foreign-born share (3.8%) is low, reflecting Mishawaka’s limited role as an immigrant destination.
The future
Mishawaka’s population is projected to remain stable or decline slightly, as the city’s birth rate is below replacement and in-migration is modest. The white population is aging and shrinking, while Hispanic and Black shares are slowly increasing. The city is not tribalizing into stark enclaves—neighborhoods remain mixed by class and ethnicity—but there is a subtle sorting: younger families and professionals gravitate toward the Merrifield Park area for its newer housing and schools, while older, poorer residents concentrate in the Eastside. Immigrant communities, particularly Hispanic, are growing but from a small base; they are likely to assimilate into the broader working class rather than form distinct ethnic enclaves. The next 10–20 years will likely see Mishawaka become slightly more diverse, but it will remain a predominantly white, middle-income city with a manufacturing legacy. The biggest wildcard is economic: if the region attracts new industry (e.g., electric vehicle battery plants in nearby New Carlisle), the population could stabilize or grow, drawing both domestic and international workers.
For someone moving in now, Mishawaka offers a stable, affordable, and safe environment with a strong sense of local history. It is not a boomtown or a melting pot, but a steady, family-oriented city where the population is slowly diversifying without dramatic upheaval. The key trade-off is between low cost of living and limited economic dynamism—a choice that suits those seeking predictability over rapid change.
* Values derived from national, state, county, city and local statistics and may differ in a specific area. Last updated: 2026-04-22T09:59:27.000Z
Narrative content on this page is AI-generated and may contain mistakes. Verify any details that matter before acting on them.
ReloMaps may earn a commission from affiliate links at no extra cost to you.