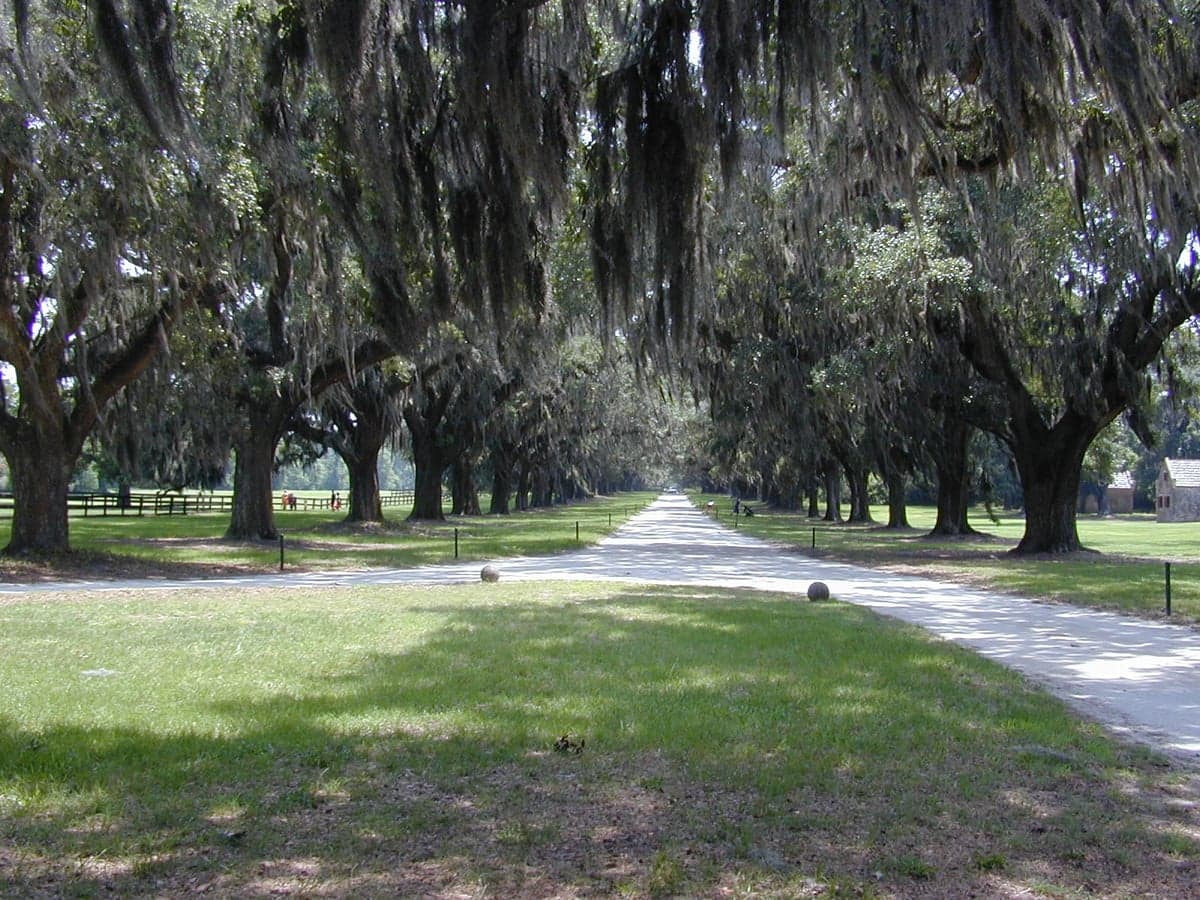
Photo: Wikipedia
Quality of Life in Mount Pleasant, SC
A high quality of life with strong walkability, manageable living costs, healthy neighborhood signals, and solid amenity access.
What does Quality of Life tell us?
Quality of Life blends cost of living, nearby amenities, socioeconomic signals, and neighborhood character. City-level scores represent the whole municipality; individual neighborhoods can differ.
What does this tell us?
Quality of Life blends cost of living, nearby amenities, socioeconomic signals, and neighborhood character. City-level scores represent the whole municipality; individual neighborhoods can differ.
Cost of Living
99% above national average
The Real Cost of Living in Mount Pleasant, SC for 2026
| Tier | Individual | Family (4) |
|---|---|---|
| Survival | $32k | $61k |
| Comfortable | $130k | $191k |
| Luxury | $219k+ | $340k+ |
| Elite (Top 5%) | $273k+ | $424k+ |
64%
The Area Signal
A metric tracking the socioeconomic signals of the area.
Hobbies
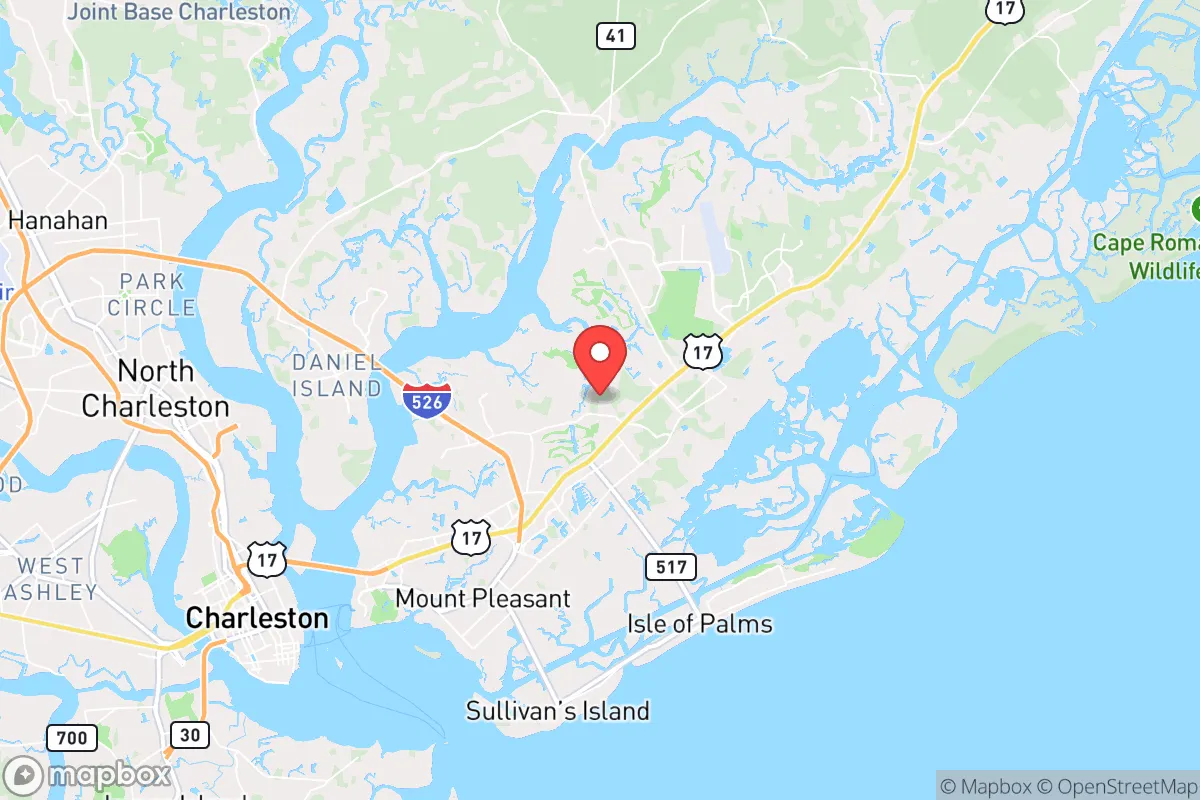
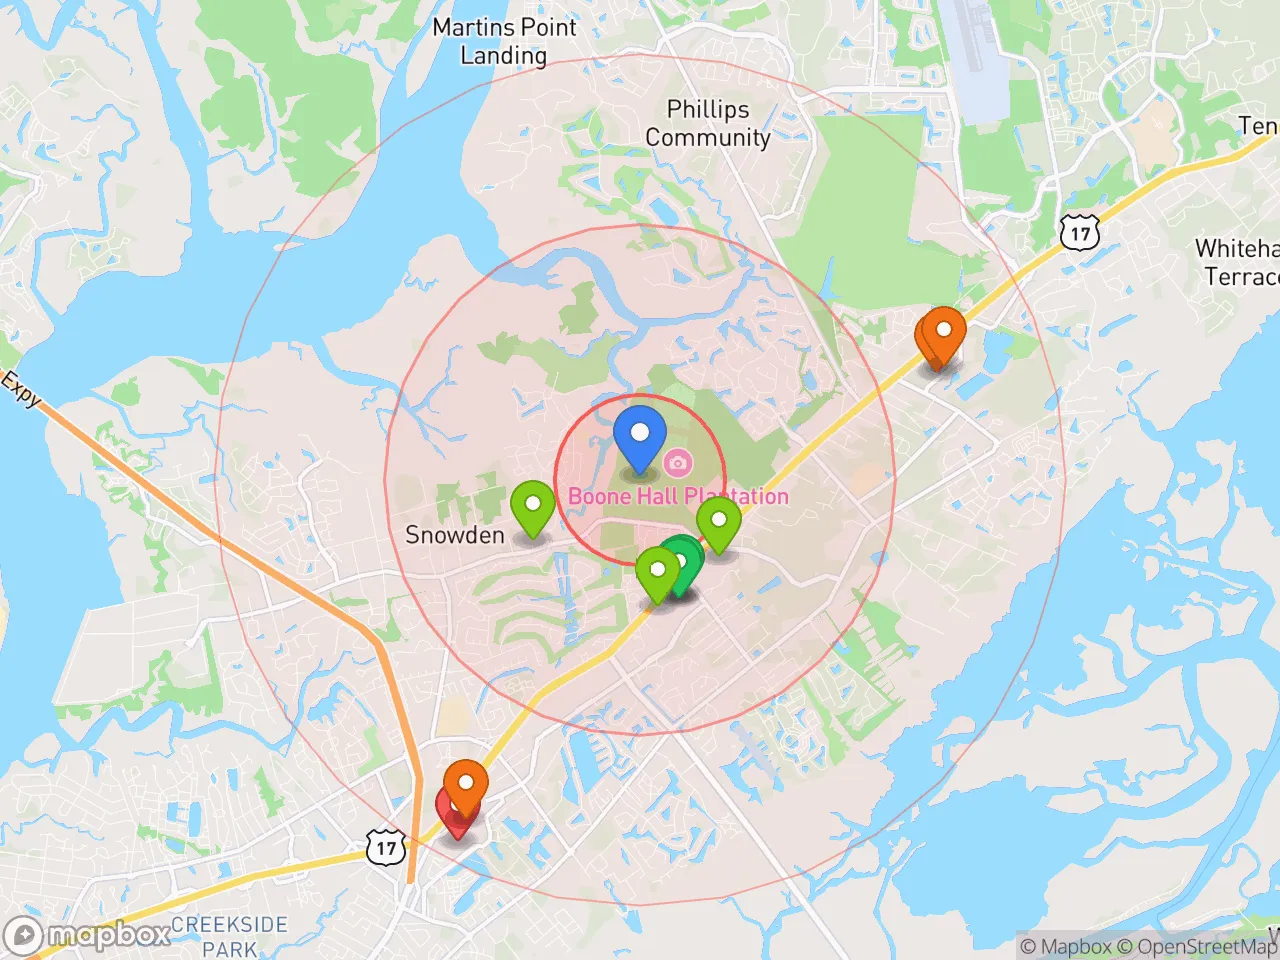
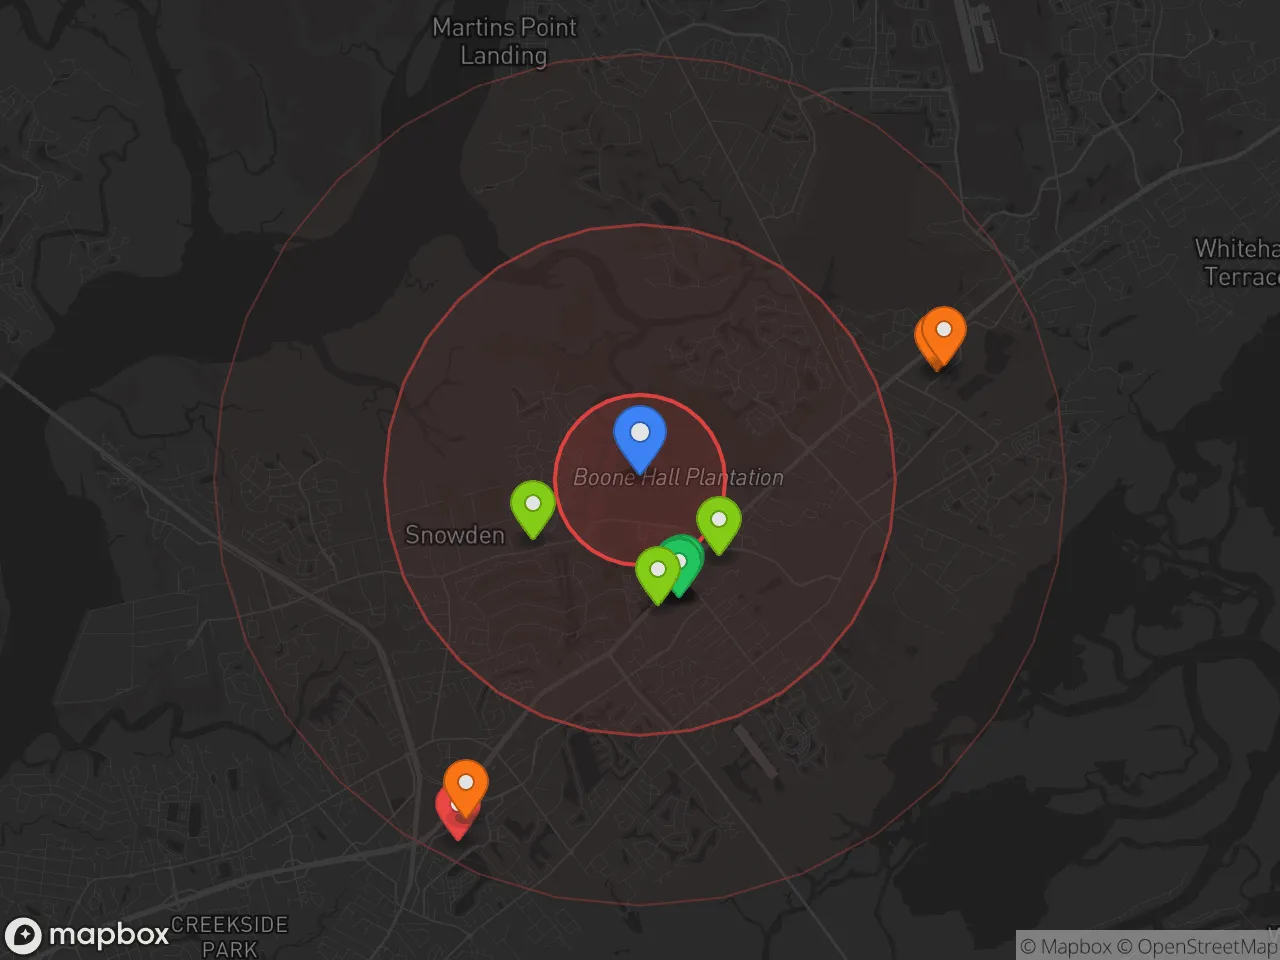
Explore the areaGroceries
7 within 10 miles
Gas
20 within 10 miles
Hospital
11 within 20 miles
Airport
CLT — Charlotte Douglas International
Post Office
USPS — Mount Pleasant, SC
Critical Amenities
Quality-of-Life Analysis
Mount Pleasant, South Carolina, is one of the Charleston area’s most affluent suburbs, with a cost of living index of 199—nearly double the U.S. average—reflecting its desirability among professionals, military families connected to nearby Joint Base Charleston, and retirees seeking coastal living. The town’s population skews toward higher-income households, with a median home value of $667,100 and a median rent of $2,026, placing it firmly in the upper tier of Charleston metro communities. This prosperity shapes daily life, from the well-funded public schools to the polished retail corridors along Highway 17, creating a community where convenience and comfort are prioritized but come at a premium.
How housing costs and affordability compare to Charleston and Mount Pleasant
Mount Pleasant’s housing market is significantly more expensive than neighboring areas like North Charleston or Summerville, where median home values often fall below $400,000. The median home value of $667,100 here is roughly 70% higher than the Charleston metro average, and the median rent of $2,026 exceeds the regional median by about 30%. While the cost of living index of 199 is driven primarily by housing, other expenses—groceries, healthcare, and transportation—also run above national norms, though less dramatically. For buyers, the trade-off is proximity to Charleston’s historic downtown (a 15-minute drive) and top-tier schools, but first-time homebuyers or renters on a single income often find the market prohibitive. Property taxes in Mount Pleasant are relatively moderate for South Carolina (around 0.5% of assessed value), which slightly offsets the high purchase prices, but the overall affordability gap with the rest of the Lowcountry remains stark.
What daily life is like for families: schools, amenities, and commute
Daily life in Mount Pleasant revolves around its highly rated public schools—particularly Wando High School, one of the largest and most academically competitive in the state—and a dense network of parks, trails, and waterfront access. The town’s average commute of 25.2 minutes is manageable by suburban standards, though traffic on the Ravenel Bridge into Charleston can spike during rush hour, pushing some trips to 40 minutes. Amenities are abundant: the Mount Pleasant Towne Centre and Belle Hall Shopping Center offer upscale dining, boutique retail, and services, while Shem Creek Park provides a hub for kayaking, paddleboarding, and seafood restaurants. The rhythm of life here is car-dependent but walkable in pockets, especially near the Old Village and I’On neighborhoods, where tree-lined streets and community pools foster a neighborly feel. For families, the combination of low crime rates, strong school performance, and year-round outdoor recreation (from Sullivan’s Island beaches to the Palmetto Islands County Park) creates a stable, activity-rich environment.
Mount Pleasant is best suited for established professionals, dual-income families, and military officers stationed at nearby bases who can absorb the high housing costs in exchange for top-tier schools and coastal proximity. Empty nesters and retirees also thrive here, particularly in age-restricted communities like The Ponds or in waterfront condos near Shem Creek. Those on tighter budgets, young renters, or workers commuting to lower-paying jobs in Charleston’s hospitality sector may find the cost burden too heavy, often opting for more affordable suburbs like Hanahan or Goose Creek. For those who can afford the premium, Mount Pleasant delivers a polished, low-stress version of Lowcountry living with few compromises.
Crime in Mount Pleasant, SC
Lower crime rates than 79% of comparable U.S. locations.
Violent CrimeViolent Crime Analysis
Property CrimeProperty Crime Analysis
Crime Analysis
Mount Pleasant, South Carolina, reports a violent crime rate of 131.3 incidents per 100,000 residents and a property crime rate of 1,018.3 per 100,000. These figures place the town in a complex safety position: violent crime is notably lower than both the national average and the Charleston metro area, but property crime runs slightly above the national benchmark. The overall safety picture is shaped by the town’s affluence and proximity to Charleston, though residents should be aware of the regional criminal justice environment.
Crime in context
Mount Pleasant’s violent crime rate of 131.3 per 100,000 is roughly 60% lower than the U.S. average of 380 per 100,000 and significantly below South Carolina’s state rate of about 490 per 100,000. Homicides are rare, typically 0–2 per year. Property crime, however, stands at 1,018.3 per 100,000, which is about 10% higher than the national property crime rate of roughly 1,950 per 100,000 — a figure that is actually below the national average when adjusted for population density. The primary driver is larceny-theft, particularly from vehicles and retail areas like Towne Centre. A critical factor for readers is that Mount Pleasant falls within the jurisdiction of the Ninth Judicial Circuit, which includes Charleston County. Progressive prosecutorial policies in the Charleston area, including a focus on diversion programs and reduced bond amounts for non-violent offenders, have been cited by local law enforcement as contributing to repeat property crime and a perception of leniency. This ideological approach, while intended to reduce incarceration, can result in more criminals on the street and diminished justice for victims, a dynamic residents should weigh carefully.
What residents experience
Daily life in Mount Pleasant is generally safe, with most violent crime concentrated in isolated incidents rather than random attacks. The most common resident complaint is vehicle break-ins and package theft, especially in apartment complexes and neighborhoods near Highway 17. Police response times average under 10 minutes for priority calls, and the Mount Pleasant Police Department maintains a visible presence through community policing. However, the progressive justice environment means that even when suspects are arrested, they may face reduced charges or quick release, frustrating victims and creating a cycle of recidivism. Residents should practice standard urban precautions: locking cars, securing garages, and using home security systems.
Neighborhood-level variation
Safety varies notably by area. Old Village and I’On report the lowest crime rates, with violent crime near zero and property crime well below the town average. Areas along Highway 17 and near the Wando Crossing shopping district see higher property crime, particularly retail theft and vehicle larceny. Apartment complexes near Long Point Road and the Isle of Palms Connector have experienced occasional burglaries. The town’s overall low violent crime rate is a strong positive, but the property crime risk and the regional prosecutorial climate — which prioritizes offender rehabilitation over public safety — are significant concerns for anyone considering relocation.
* Values derived from national, state, county, city and local statistics and may differ in a specific area. Last updated: 2026-04-29T22:15:30.000Z
Narrative content on this page is AI-generated and may contain mistakes. Verify any details that matter before acting on them.
ReloMaps may earn a commission from affiliate links at no extra cost to you.