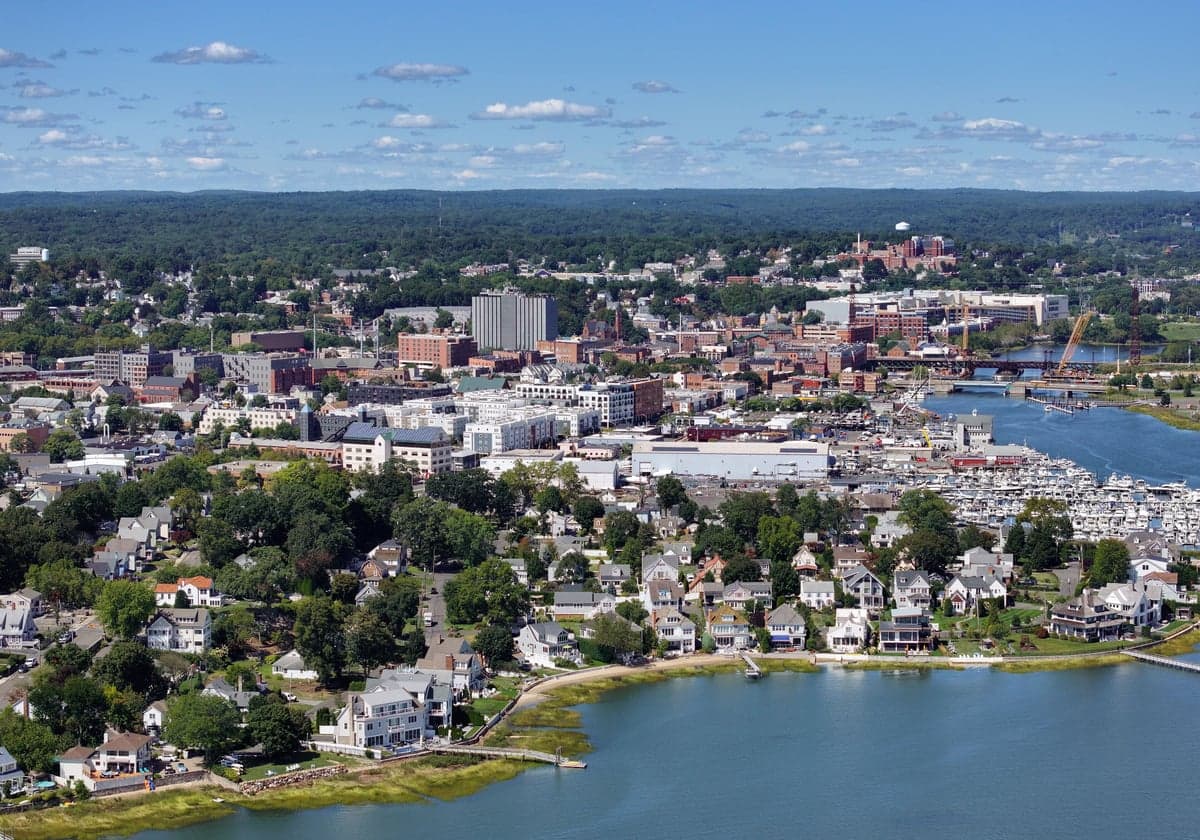
Photo: Wikipedia
Demographics of Norwalk, CT
Affluence Level in Norwalk, CT
An upper-middle-class area. Household wealth, education levels, and homeownership run ahead of national benchmarks.
People of Norwalk, CT
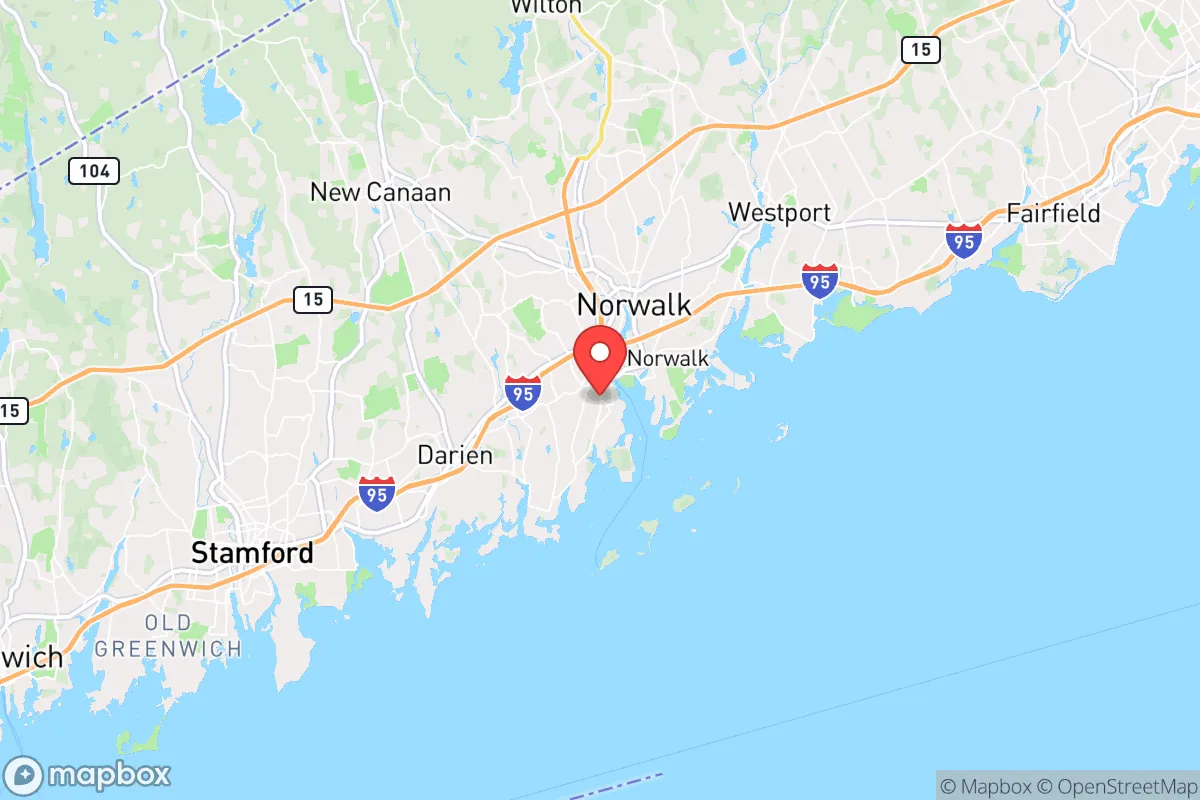
The people of Norwalk, Connecticut today form a dense, ethnically layered city of 91,375 residents, where no single group holds a majority. With a population that is 42.7% white, 31.4% Hispanic, 17.5% Black, 2.1% East/Southeast Asian, and 2.5% Indian, Norwalk is one of the most diverse municipalities in Fairfield County. Its identity is shaped by a long history of immigrant waves, industrial booms, and suburbanization, producing a city that feels both urban and coastal, with distinct neighborhoods that still reflect the communities that built them.
How the city was settled and grew
Norwalk’s original European settlement began in 1649, when English colonists from Hartford purchased land from the Siwanoy tribe. The town grew slowly as an agricultural and maritime hub through the 18th century, with shipbuilding and oystering driving early commerce. The arrival of the railroad in the 1840s transformed Norwalk into a manufacturing center, drawing Irish immigrants who settled in South Norwalk (often called SoNo) to work in the hat factories, iron foundries, and the Norwalk Lock Company. By the late 19th century, Italian immigrants followed, clustering in East Norwalk and Central Norwalk, where they worked in the city’s thriving shoe and textile mills. A smaller wave of German and Polish immigrants also arrived, settling in Rowayton and the Silvermine area, where they found work in the granite quarries and as skilled tradesmen. By 1900, Norwalk’s population had reached roughly 25,000, a mix of Yankee Protestants, Irish Catholics, and Italian laborers, with distinct ethnic enclaves already forming along the harbor and rail lines.
Modern era (post-1965)
The 1965 Hart-Cellar Immigration Act and the construction of Interstate 95 in the 1960s reshaped Norwalk’s demographics dramatically. The city’s industrial base declined, and white middle-class families began moving to newer suburbs like Wilton and New Canaan, opening housing stock in older neighborhoods. South Norwalk became a primary entry point for Black families arriving from the American South during the Great Migration, and later for Puerto Rican and Dominican migrants in the 1970s and 1980s. Today, South Norwalk remains the city’s most diverse and densely populated neighborhood, with a population that is roughly 40% Hispanic, 30% Black, and 20% white. East Norwalk absorbed a significant Haitian community in the 1980s and 1990s, alongside growing numbers of Guatemalan and Salvadoran immigrants. The Brookside and Oyster Shell Park areas saw an influx of Indian professionals in the 2000s, drawn by tech and finance jobs in Stamford and New York City; the Indian population now stands at 2.5%, with a visible cluster of South Asian grocery stores and restaurants along Connecticut Avenue. East/Southeast Asian residents (2.1%) are more dispersed, with a small but established Chinese community in West Norwalk and a growing Filipino presence in the Silvermine area. The Hispanic population, now 31.4%, is the fastest-growing demographic, driven by continued immigration from Central America and high birth rates, and is concentrated in South Norwalk and the Washington Village public housing complex.
The future
Norwalk’s population is trending toward a tripartite structure: a shrinking white share (down from 55% in 2000), a stable Black share, and a rapidly growing Hispanic share that is projected to approach 40% by 2035. The Indian and East/Southeast Asian communities are growing slowly but steadily, driven by professional migration to the region’s corporate hubs. Gentrification pressures are most acute in South Norwalk, where new luxury apartments along the waterfront are drawing younger white and Asian professionals, creating tension with long-standing Hispanic and Black residents. The city is not homogenizing; rather, it is tribalizing into distinct enclaves, with Rowayton remaining overwhelmingly white and affluent, South Norwalk diversifying but under economic strain, and East Norwalk becoming a middle-class Hispanic and Black stronghold. The foreign-born share (14.9%) is slightly below the national average, suggesting that second- and third-generation assimilation is occurring, but new immigration from Central America continues to replenish the Hispanic population.
For someone moving to Norwalk today, the city offers a genuinely multiethnic environment where no single group dominates, but where neighborhood choice largely determines daily experience. The city is becoming more Hispanic and more professional, with rising housing costs pushing lower-income residents toward the edges. It is a place where a conservative-leaning resident will find stable, family-oriented enclaves in Rowayton and Silvermine, but also a politically liberal city government and a school system grappling with growing diversity and income inequality.
* Values derived from national, state, county, city and local statistics and may differ in a specific area. Last updated: 2026-04-30T03:22:21.000Z
Narrative content on this page is AI-generated and may contain mistakes. Verify any details that matter before acting on them.
ReloMaps may earn a commission from affiliate links at no extra cost to you.