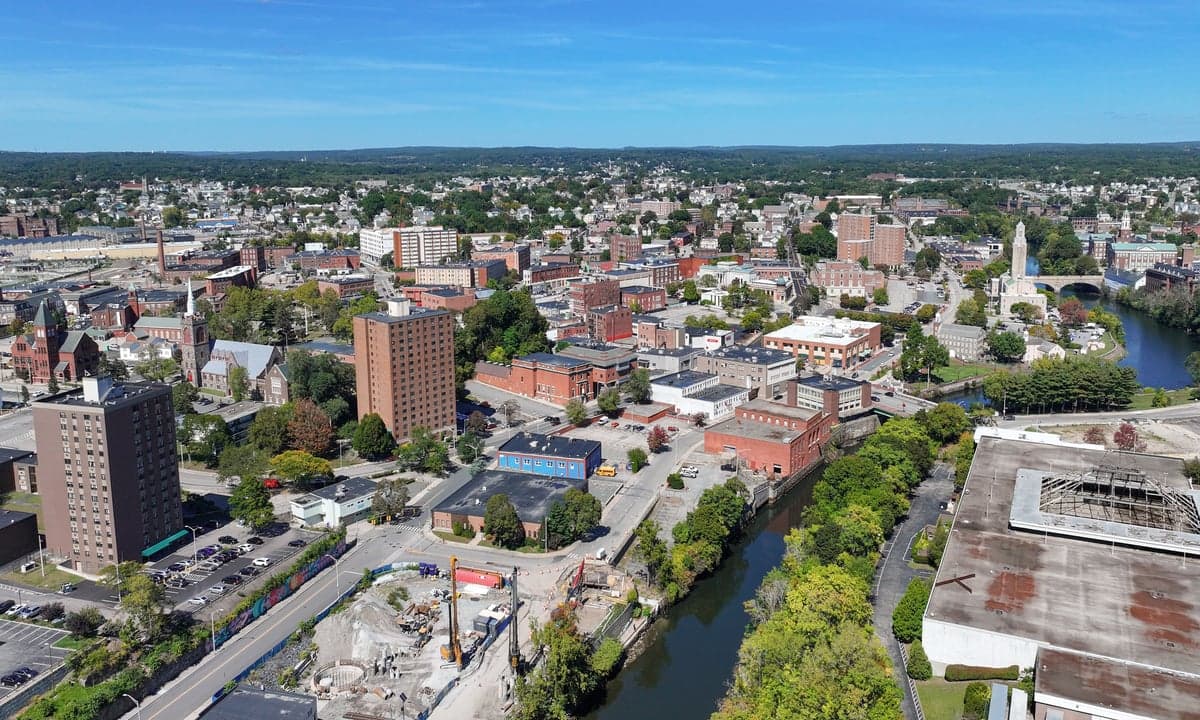
Photo: Wikipedia
Quality of Life in Pawtucket, RI
A high quality of life with strong walkability, manageable living costs, healthy neighborhood signals, and solid amenity access.
What does Quality of Life tell us?
Quality of Life blends cost of living, nearby amenities, socioeconomic signals, and neighborhood character. City-level scores represent the whole municipality; individual neighborhoods can differ.
What does this tell us?
Quality of Life blends cost of living, nearby amenities, socioeconomic signals, and neighborhood character. City-level scores represent the whole municipality; individual neighborhoods can differ.
Cost of Living
The Real Cost of Living in Pawtucket, RI for 2026
| Tier | Individual | Family (4) |
|---|---|---|
| Survival | $18k | $35k |
| Comfortable | $56k | $82k |
| Luxury | $109k+ | $169k+ |
| Elite (Top 5%) | $129k+ | $199k+ |
83%
The Area Signal
A metric tracking the socioeconomic signals of the area.


Hobbies
Explore the areaGroceries
10 within 10 miles
Gas
20 within 10 miles
Hospital
3 within 20 miles
Airport
BOS — Boston Logan International
Post Office
USPS — Pawtucket, RI
Critical Amenities
Quality-of-Life Analysis
Pawtucket, Rhode Island, offers a middle-income, family-oriented quality of life that stands apart from pricier Boston suburbs and coastal Rhode Island towns. With a cost of living index of exactly 100 (matching the U.S. average), the city attracts a mix of young professionals, long-term blue-collar families, and first-time homebuyers priced out of Providence or the East Bay. The median household income hovers around $55,000, reflecting a working-to-middle-class population that values affordability and urban convenience over suburban exclusivity.
How housing costs and affordability compare to Providence and Boston
Pawtucket’s housing market is notably accessible for the region. The median home value of $286,200 is roughly 40% lower than Providence’s median and a fraction of Boston-area prices, making it one of the most affordable cities in Rhode Island with direct commuter rail access. Median rent sits at $1,152, well below the state average of $1,400, and significantly cheaper than nearby East Providence or Barrington. The average commute of 25.7 minutes is shorter than the national average of 27 minutes, a practical advantage for workers heading to Providence (10–15 minutes) or Boston (about 50 minutes via the MBTA Commuter Rail). Property taxes in Pawtucket are moderate for Rhode Island, at roughly $14.50 per $1,000 of assessed value, though buyers should note that older housing stock often requires renovation. Renters and buyers alike find that Pawtucket delivers more square footage per dollar than any community within a 20-mile radius of Providence.
What daily life is like for families: schools, parks, and local amenities
Daily life in Pawtucket centers on a compact, walkable urban grid with a strong sense of neighborhood identity. The city’s public school system includes Pawtucket High School and several elementary schools, though many families supplement with nearby Catholic or charter options like the Blackstone Valley Prep Mayoral Academy. For recreation, Slater Memorial Park offers 200 acres of trails, a carousel, and a public pool, while the Blackstone River Bikeway connects cyclists to Providence and Worcester. The city’s cultural anchor is the Pawtucket Armory Arts Center, hosting concerts and markets, and the historic Pawtucket Red Sox ballpark (McCoy Stadium) draws minor-league baseball fans. Grocery access is solid, with a Stop & Shop and several ethnic markets along Mineral Spring Avenue, but fine dining and boutique shopping are limited compared to Providence’s Federal Hill or Wayland Square. The Pawtucket-Central Falls Transit Center provides bus and rail links, reducing car dependency for commuters. Families appreciate the low crime rate relative to similarly dense Rhode Island cities, though property crime rates are slightly above the national average.
Pawtucket is best suited for budget-conscious homebuyers, young families, and commuters who prioritize affordability and transit access over suburban schools or nightlife. First-time buyers can enter the market here at half the cost of Providence, while renters enjoy some of the lowest rates in the state. Those who thrive here value a gritty, authentic urban environment with easy access to both Providence’s job market and Boston’s economy, and are willing to trade polished amenities for financial breathing room. Retirees on fixed incomes also find the low rent and walkable core appealing, though those seeking quiet, car-dependent suburbs should look to Attleboro or Lincoln instead.
Crime in Pawtucket, RI
Generally safer than 59% of comparable U.S. locations.
Violent CrimeViolent Crime Analysis
Property CrimeProperty Crime Analysis
Crime Analysis
Pawtucket, Rhode Island, presents a safety profile that warrants careful consideration for potential residents. The city’s violent crime rate of 223.9 per 100,000 residents and property crime rate of 1,240.1 per 100,000 place it above national averages, a reality shaped in part by the broader criminal justice environment in Rhode Island’s liberal-leaning metro area. Progressive district attorneys and judges in the region, while focused on rehabilitation, have been associated with policies that can reduce consequences for repeat offenders, potentially increasing risks for law-abiding residents and victims.
Crime in context
Pawtucket’s violent crime rate of 223.9 per 100,000 is roughly 60% higher than the national average of about 140 per 100,000, though it remains below the rates of larger nearby cities like Providence. Property crime in Pawtucket, at 1,240.1 per 100,000, exceeds the national average of approximately 1,100 per 100,000. These figures reflect a city that struggles with property offenses—burglary, theft, and motor vehicle theft—more than violent incidents. However, the presence of progressive prosecutorial policies in Rhode Island’s judicial system, which often prioritize diversion and reduced sentencing for non-violent offenders, can create a revolving-door effect that undermines deterrence and leaves residents feeling less protected.
What residents experience
Daily life in Pawtucket involves navigating a mix of older, densely populated neighborhoods and commercial corridors where property crime is a persistent concern. Residents commonly report issues like package theft, car break-ins, and vandalism, particularly in areas near the city’s main thoroughfares (e.g., Newport Avenue, Dexter Street). The city’s proximity to Providence and Boston means that property crime patterns are influenced by regional mobility, with offenders exploiting transit links. While violent crime is less frequent, incidents such as aggravated assault and robbery do occur, often concentrated in specific blocks. The local police department has implemented community policing initiatives, but the broader judicial environment—where progressive judges may impose lighter sentences or probation instead of incarceration—can erode the deterrent effect of arrests, leading to higher recidivism and a sense of impunity among some offenders.
Neighborhood-level variation
Safety in Pawtucket varies significantly by neighborhood. The Oak Hill and Darlington areas are generally considered safer, with lower crime rates and more active neighborhood watches, appealing to families and long-term residents. In contrast, the Woodlawn and Fairlawn sections, particularly near the city’s industrial zones and public housing complexes, experience higher concentrations of property crime and occasional violent incidents. The downtown corridor around the Pawtucket-Central Falls Transit Center sees elevated theft and disorder, partly due to transient populations. Prospective residents should research specific street-level data and visit at different times of day, as the city’s compact layout means that safety can shift dramatically within a few blocks. The progressive justice policies in Rhode Island’s metro area mean that even in safer pockets, residents may encounter repeat offenders cycling through the system, a factor that adds a layer of concern beyond raw crime statistics.
* Values derived from national, state, county, city and local statistics and may differ in a specific area. Last updated: 2026-04-20T17:55:19.000Z
Narrative content on this page is AI-generated and may contain mistakes. Verify any details that matter before acting on them.
ReloMaps may earn a commission from affiliate links at no extra cost to you.