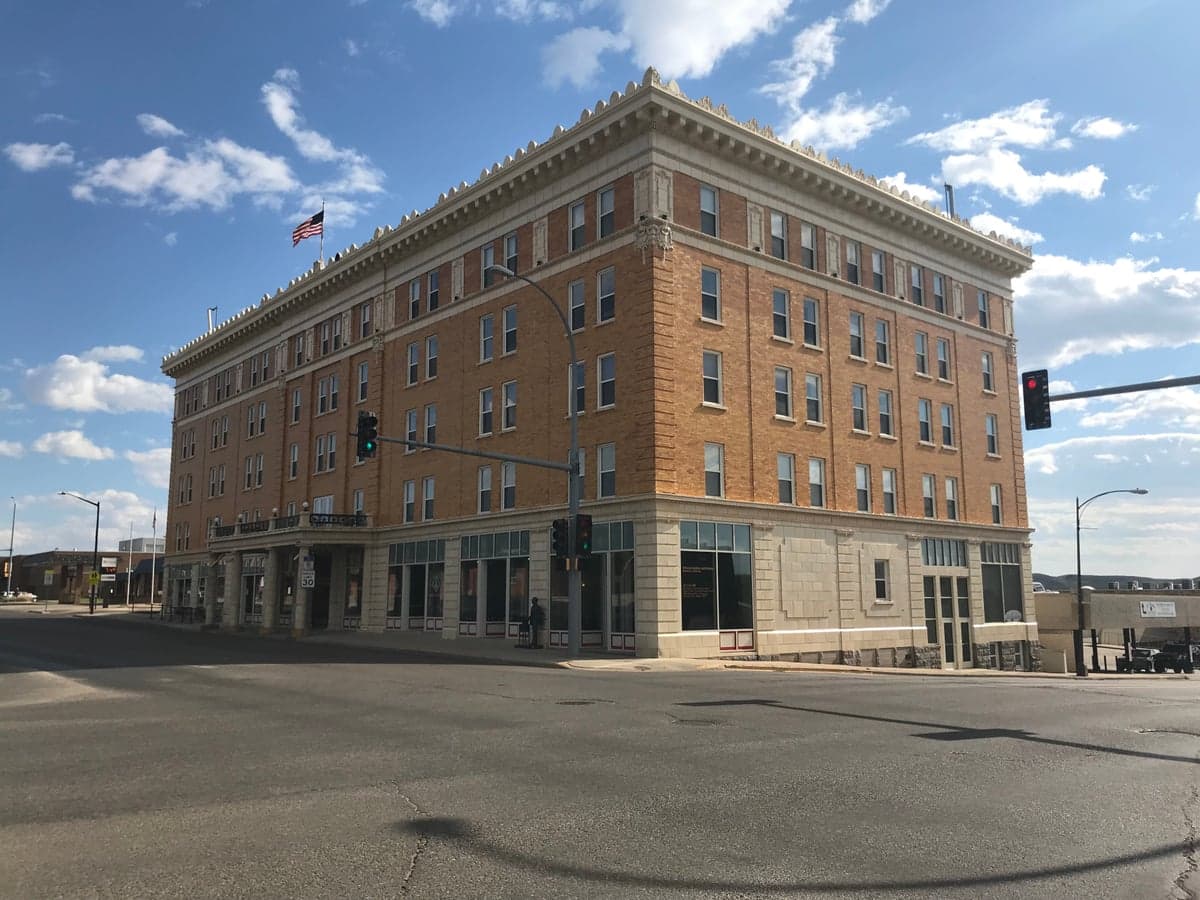
Photo: Wikipedia
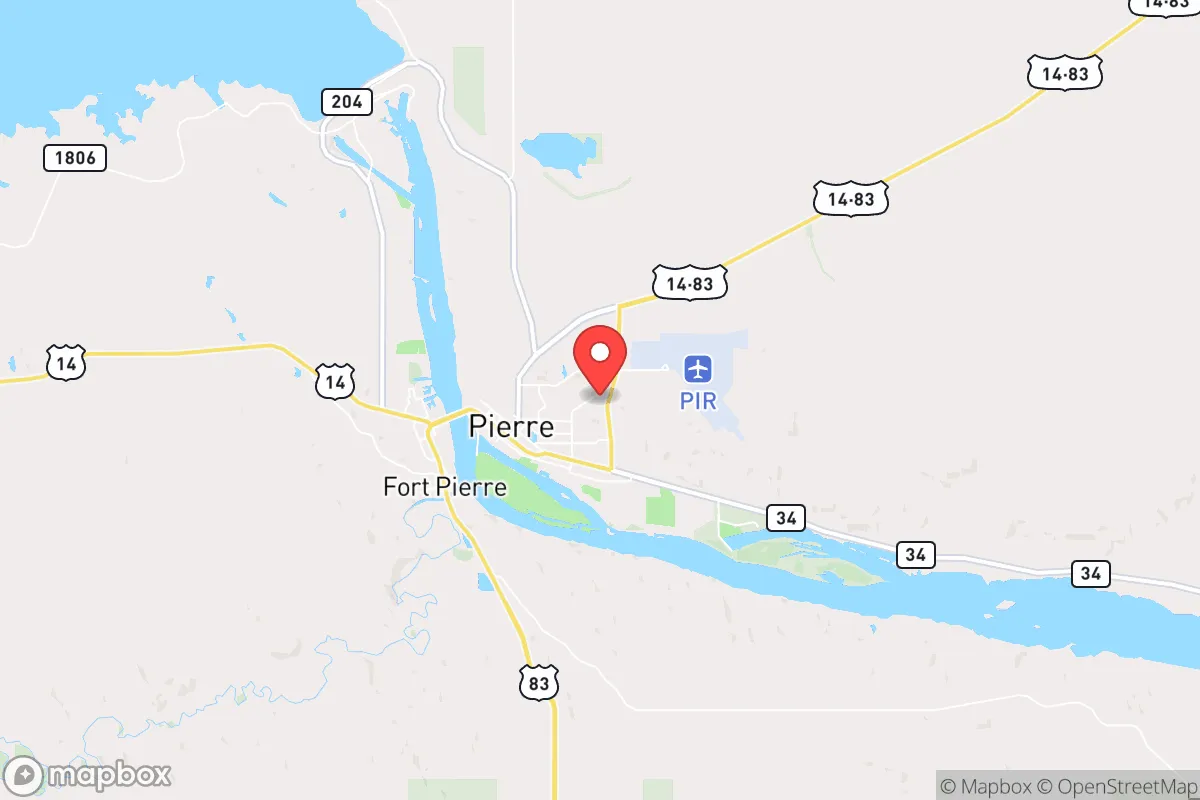
Demographics of Pierre, SD
Affluence Level in Pierre, SD
A middle-class area roughly in line with national averages across income, home values, education, and employment.
People of Pierre, SD
The people of Pierre, South Dakota today form a small, stable, and predominantly white population of 14,008, with a distinctive identity shaped by state government employment and outdoor recreation along the Missouri River. The city is notably homogeneous: 81.7% white, with a Hispanic population of just 3.7%, East/Southeast Asian residents at 1.0%, and a foreign-born share of only 0.2%. Pierre’s character is that of a tight-knit, family-oriented state capital where civic life and seasonal tourism anchor daily routines, and where demographic change has been minimal for decades.
How the city was settled and grew
Pierre was founded in 1880 as a railroad terminus on the Missouri River, named after fur trader Pierre Chouteau Jr. The original population was drawn by the promise of rail construction jobs and river commerce, with the Chicago and North Western Railway establishing a depot that spurred immediate growth. The city was designated the state capital in 1889, which shifted the economic base from transportation to government administration. Early settlers were overwhelmingly of Northern European stock—German, Norwegian, and Irish immigrants—who built the first homes in the Fort Pierre district across the river and the original downtown grid near the riverfront. The 1890s saw a second wave of homesteaders arriving under the federal Homestead Act, claiming land in the surrounding plains and establishing farms that supplied the growing capital. By 1910, Pierre’s population had reached 3,656, with neighborhoods like Riverside emerging along the Missouri bluffs to house railroad workers and state employees. The construction of the Oahe Dam in the 1950s and 1960s brought a temporary influx of construction workers, many of whom stayed and settled in the North Pierre area, adding a modest working-class element to the city’s government-oriented profile.
Modern era (post-1965)
After the 1965 Hart-Cellar Act, Pierre saw virtually no impact from new immigration waves—its foreign-born population remains at 0.2% today, one of the lowest rates in any U.S. state capital. Domestic in-migration has been the primary driver of population change since the 1970s, with state government expansion and the growth of the South Dakota Department of Tourism attracting professionals from other parts of the Midwest. The Hillsview subdivision, developed in the 1980s and 1990s, absorbed many of these incoming state workers and their families, offering newer single-family homes on the city’s west side. The Rawlins neighborhood, near the Capitol complex, became a concentration of longtime state employees and retirees. Pierre’s racial composition has remained remarkably stable: the white share has hovered around 80-85% since 1990, with the Hispanic population growing only from 1.2% in 2000 to 3.7% today, largely through seasonal agricultural labor in surrounding counties rather than permanent settlement within city limits. The East/Southeast Asian population, at 1.0%, is primarily composed of medical professionals recruited to Avera St. Mary’s Hospital and their families, concentrated in the South Pierre area near the hospital campus. There is no measurable Indian-subcontinent population (0.0%) and no Black population (0.0%), reflecting the city’s persistent lack of diversity.
The future
Pierre’s population is projected to remain flat or grow very slowly over the next 10-20 years, with the state demographer estimating a 1-2% increase by 2040. The city is not homogenizing further—it is already near-maximum homogeneity—but it is also not tribalizing into distinct ethnic enclaves, as no immigrant community has reached a critical mass to form a visible neighborhood. The small Hispanic population is largely assimilated into existing neighborhoods like Riverside and North Pierre, with no barrio or ethnic district emerging. The East/Southeast Asian community, centered around the hospital, is too small to sustain separate institutions. The most significant demographic trend is aging: Pierre’s median age is 39.7, above the state median, and the 65+ cohort is growing as state retirees stay in place. Younger families are being drawn to newer subdivisions like Hillsview and the West Pierre area, but the overall population is unlikely to diversify significantly without a major economic shift—such as a large employer recruiting foreign workers, which has not occurred.
For someone moving to Pierre now, the city offers a stable, safe, and overwhelmingly white community where government employment and outdoor life define the rhythm. The population is not changing rapidly in composition, but it is slowly aging, and newcomers—particularly families—will find a welcoming but insular environment where social networks are built through church, school, and civic involvement rather than ethnic or cultural institutions.
* Values derived from national, state, county, city and local statistics and may differ in a specific area. Last updated: 2026-04-21T10:56:14.000Z
Narrative content on this page is AI-generated and may contain mistakes. Verify any details that matter before acting on them.
ReloMaps may earn a commission from affiliate links at no extra cost to you.