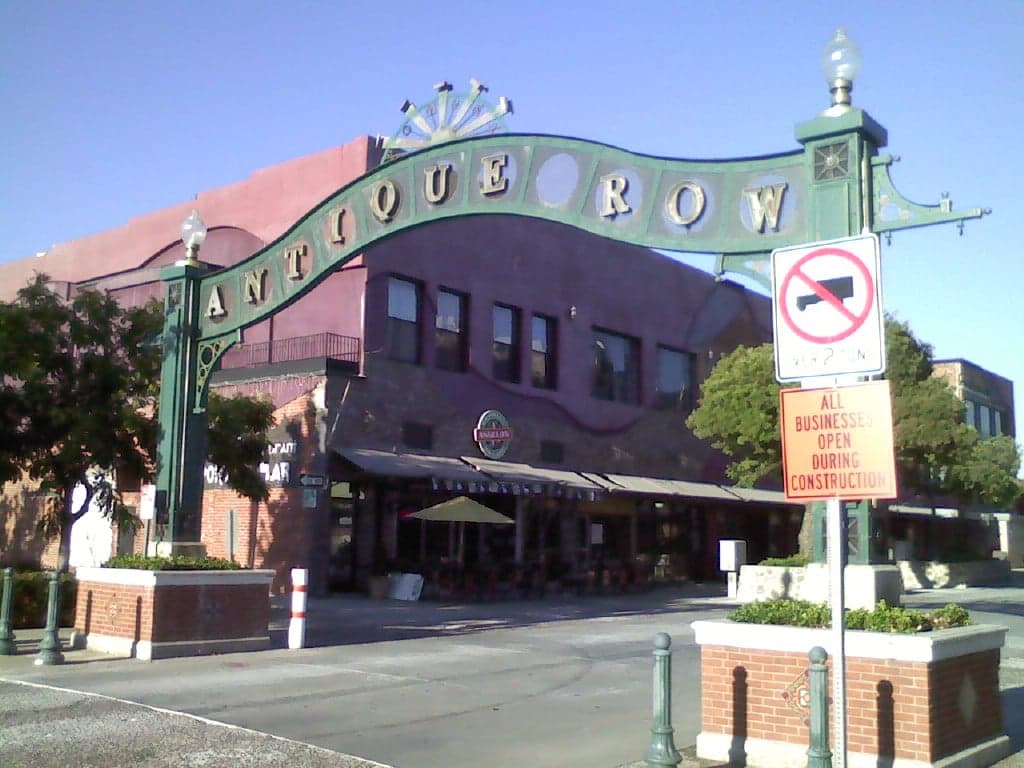
Photo: Wikipedia
Quality of Life in Pomona, CA
A high quality of life with strong walkability, manageable living costs, healthy neighborhood signals, and solid amenity access.
What does Quality of Life tell us?
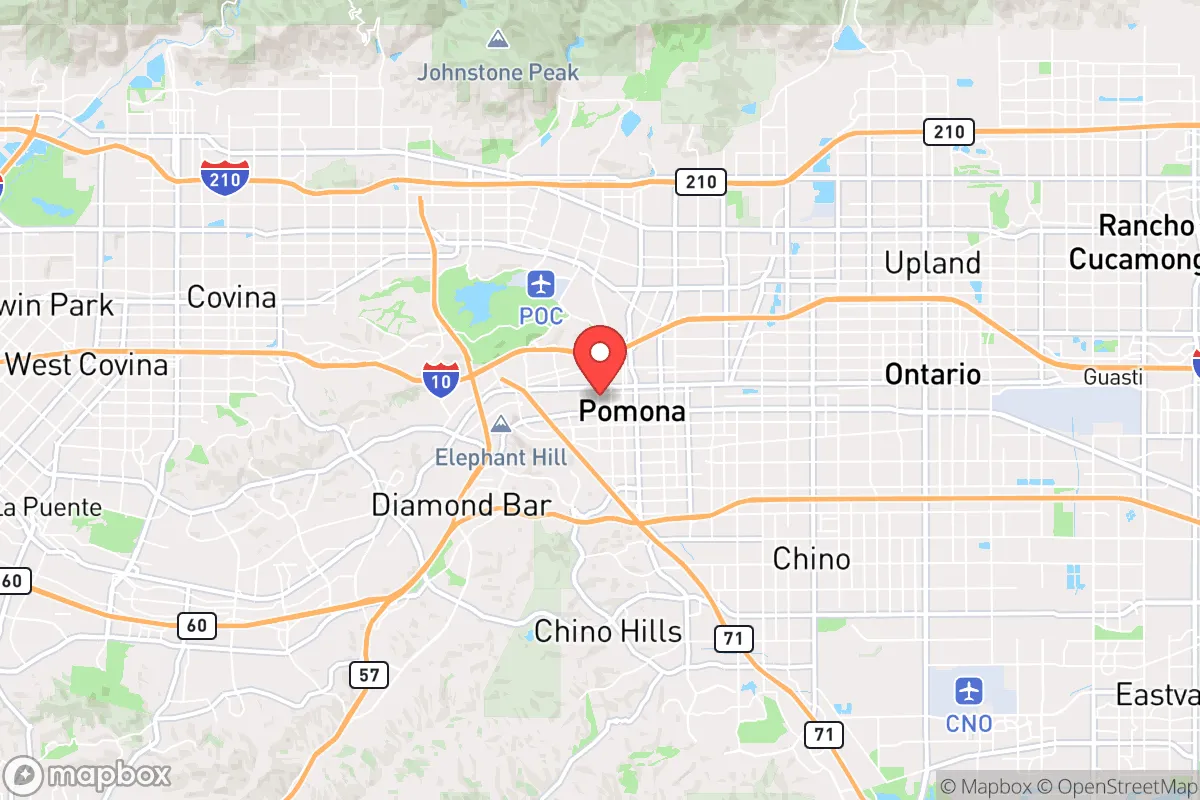
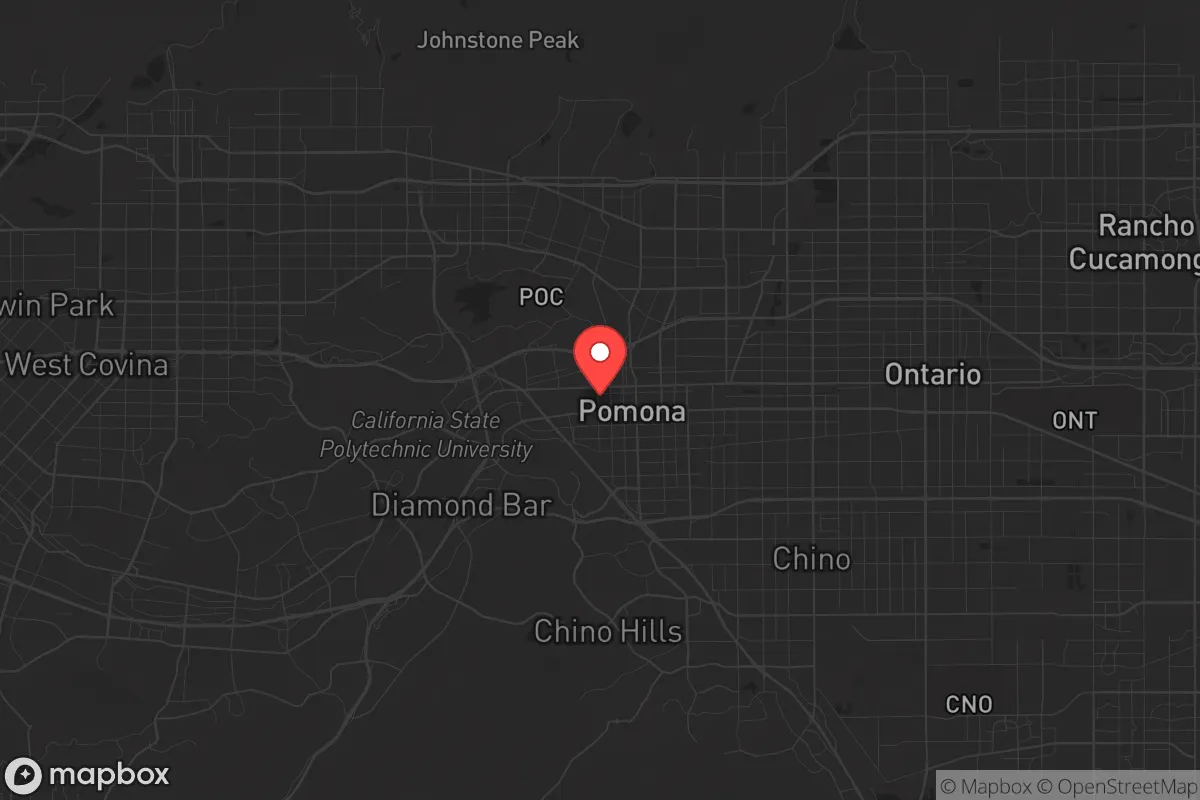
Quality of Life blends cost of living, nearby amenities, socioeconomic signals, and neighborhood character. City-level scores represent the whole municipality; individual neighborhoods can differ.
What does this tell us?
Quality of Life blends cost of living, nearby amenities, socioeconomic signals, and neighborhood character. City-level scores represent the whole municipality; individual neighborhoods can differ.
Cost of Living
70% above national average
The Real Cost of Living in Pomona, CA for 2026
| Tier | Individual | Family (4) |
|---|---|---|
| Survival | $28k | $52k |
| Comfortable | $80k | $118k |
| Luxury | $118k+ | $183k+ |
| Elite (Top 5%) | $139k+ | $215k+ |
67%
The Area Signal
A metric tracking the socioeconomic signals of the area.
Hobbies
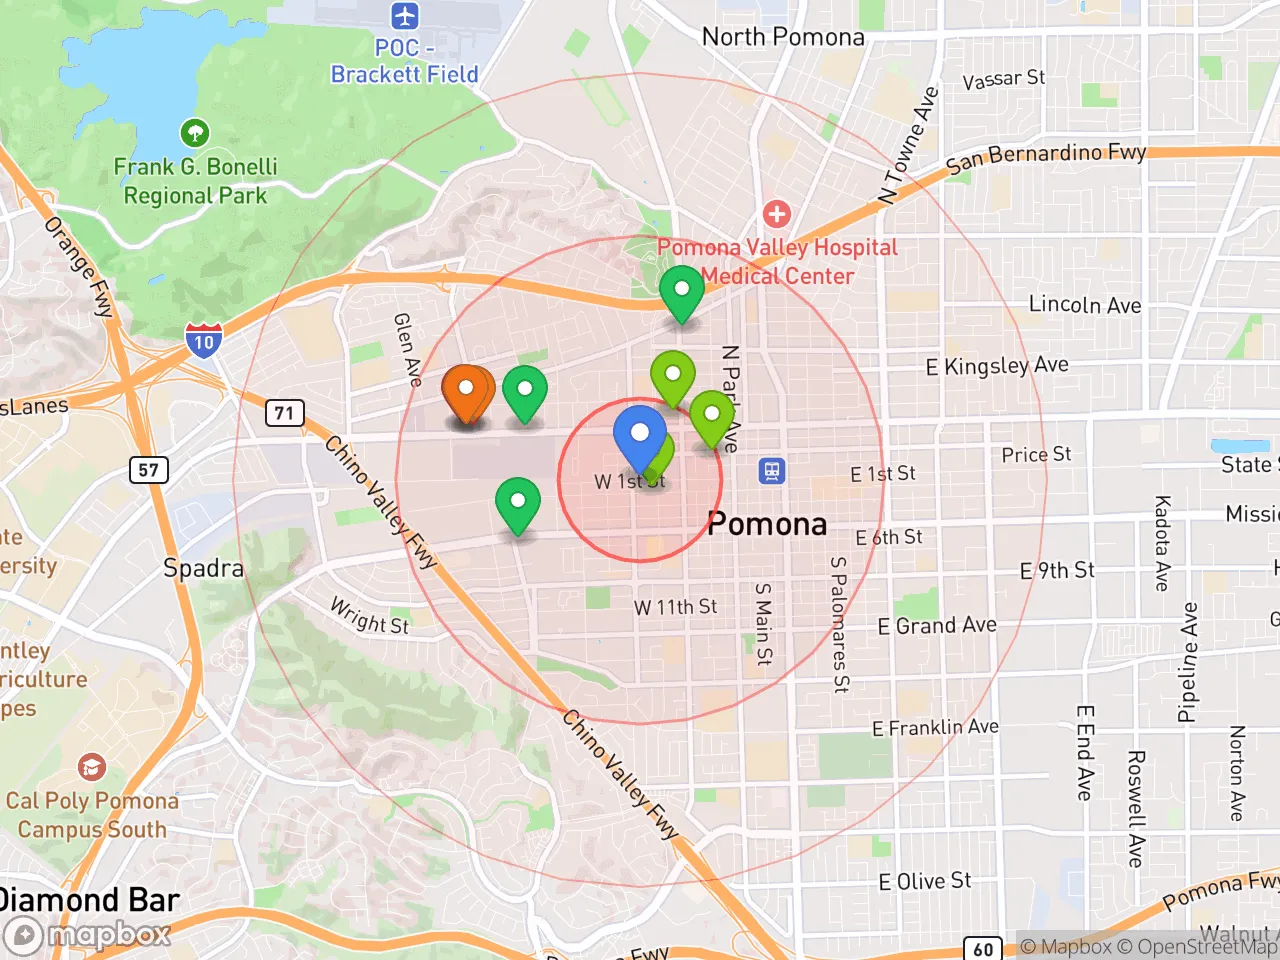
Explore the areaGroceries
7 within 10 miles
Gas
20 within 10 miles
Hospital
20 within 20 miles
Airport
SAN — San Gabriel Valley
Post Office
USPS — Pomona, CA
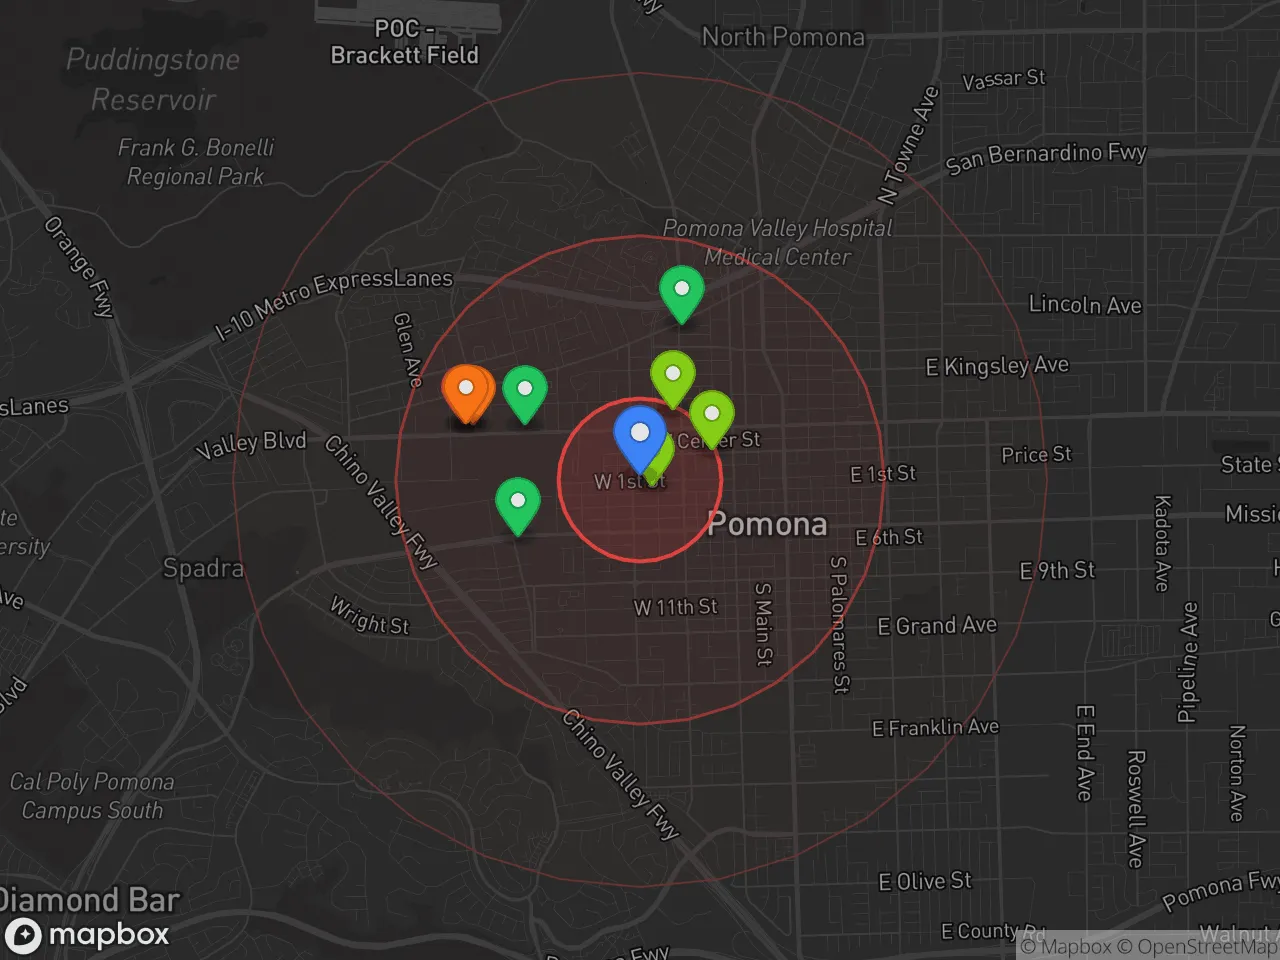
Critical Amenities
Quality-of-Life Analysis
Pomona, California, presents a complex quality-of-life picture that defies simple affluence labels. With a cost-of-living index of 170 (70% above the U.S. average), the city is more affordable than many coastal Los Angeles County neighbors but remains expensive for most middle-income households. The population is predominantly working- and middle-class, with a significant Latino majority (over 70%) and a growing number of young professionals and families drawn by relatively lower housing costs compared to Pasadena, Claremont, or downtown L.A.
Cost of living, housing affordability, and how Pomona compares to nearby cities
Pomona’s median home value of $569,600 is roughly half the median for Los Angeles County as a whole, making it one of the more attainable entry points for homebuyers in the San Gabriel Valley. Median rent sits at $1,738, which is below the countywide median of around $2,200. However, these numbers still represent a heavy burden for households earning the area’s median income of roughly $65,000. The average commute of 31.8 minutes is slightly longer than the national average but shorter than the typical L.A. County commute of 33 minutes, reflecting Pomona’s role as a bedroom community for workers in Ontario, Rancho Cucamonga, and downtown Los Angeles. Compared to neighboring Claremont (median home value ~$850,000) or San Dimas (~$750,000), Pomona offers a clear affordability advantage, though this comes with trade-offs in school quality and neighborhood amenities.
What daily life is like: amenities, schools, and local character
Daily life in Pomona is shaped by its status as a regional hub for the arts and education. The city is home to Cal Poly Pomona, a major public university with over 24,000 students, and Western University of Health Sciences, which anchors a growing health sciences corridor. The downtown Arts Colony, centered around Second Street, hosts galleries, live theater, and the monthly Pomona Art Walk. For families, the Pomona Unified School District serves roughly 20,000 students, with a handful of magnet and charter options—such as the School of Arts and Enterprise—that outperform the district’s overall below-average test scores. Outdoor recreation includes Fairplex (home to the L.A. County Fair) and nearby Frank G. Bonelli Regional Park in San Dimas, offering hiking, fishing, and camping within a 15-minute drive. The city’s walkability is low overall, and most errands require a car, though the Metrolink station provides rail access to downtown L.A. in about 45 minutes.
Pomona is best suited for budget-conscious homebuyers, students, and creative professionals who prioritize space and affordability over prestige school districts or ultra-short commutes. The city’s mix of historic Craftsman homes, mid-century apartments, and new infill development offers more square footage per dollar than any coastal L.A. suburb. However, property crime rates remain above the national average, and the city’s reputation for gang activity—though significantly improved since the 1990s—still gives some newcomers pause. For those willing to navigate these trade-offs, Pomona provides a genuine foothold in Southern California’s housing market, with a vibrant cultural scene and proximity to major employment centers in the Inland Empire and Los Angeles Basin.
Crime in Pomona, CA
Higher crime rates than 72% of comparable U.S. locations.
Violent CrimeViolent Crime Analysis
Property CrimeProperty Crime Analysis
Crime Analysis
Pomona, California, reports a violent crime rate of 645.3 incidents per 100,000 residents and a property crime rate of 2,270.2 per 100,000, placing it among the more dangerous cities in Los Angeles County. These figures reflect a community where public safety is a significant concern, particularly when viewed through the lens of the county's progressive criminal justice policies. Residents and prospective movers should weigh these statistics carefully, as they indicate a higher likelihood of victimization compared to many neighboring cities.
Crime in context
Pomona's violent crime rate is roughly 75% higher than the national average of approximately 370 per 100,000, and its property crime rate exceeds the national figure by about 20%. Within Los Angeles County, Pomona's numbers are elevated relative to cities like Diamond Bar or Chino Hills, though they are comparable to other inland valley communities such as San Bernardino. The broader context includes the impact of Los Angeles County's progressive district attorney and judiciary, who have implemented policies such as reduced bail, early release programs, and a general reluctance to prosecute certain property and drug offenses. These policies, while intended to reduce incarceration, have been linked to increased recidivism and a perception of lawlessness in cities like Pomona, where police resources are already stretched thin.
What residents experience
Residents report that property crime—particularly vehicle theft, burglary, and package theft—is a near-daily reality, especially in neighborhoods near freeway corridors like the 10 and 71. Violent crime, including aggravated assault and robbery, is concentrated in areas with higher poverty rates and gang activity, such as the neighborhoods around Holt Avenue and Garey Avenue. Many locals express frustration that repeat offenders are quickly released due to county-level progressive policies, undermining the deterrent effect of arrest. This has led to a climate where residents invest heavily in security systems, neighborhood watch programs, and even private patrol services, particularly in the more affluent areas near the Claremont border.
Neighborhood-level variation
Safety varies significantly within Pomona. The northern neighborhoods near the San Jose Hills and the Pomona College area experience notably lower crime rates, with violent crime dropping to near the national average in some census tracts. Conversely, the southern and central parts of the city, including the industrial zones and areas around the Pomona Fairplex, see the highest concentrations of both violent and property crime. Prospective residents should research specific blocks rather than relying on citywide averages, as a move from the 91766 to the 91767 zip code can mean a dramatic difference in daily safety. Ultimately, Pomona's crime challenges are deeply intertwined with county-level justice policies that prioritize leniency, placing the burden of safety on individual residents and local police.
* Values derived from national, state, county, city and local statistics and may differ in a specific area. Last updated: 2026-04-24T05:06:47.000Z
Narrative content on this page is AI-generated and may contain mistakes. Verify any details that matter before acting on them.
ReloMaps may earn a commission from affiliate links at no extra cost to you.