
Photo: Wikipedia
Quality of Life in Richland, WA
A high quality of life with strong walkability, manageable living costs, healthy neighborhood signals, and solid amenity access.
What does Quality of Life tell us?
Quality of Life blends cost of living, nearby amenities, socioeconomic signals, and neighborhood character. City-level scores represent the whole municipality; individual neighborhoods can differ.
What does this tell us?
Quality of Life blends cost of living, nearby amenities, socioeconomic signals, and neighborhood character. City-level scores represent the whole municipality; individual neighborhoods can differ.
Cost of Living
29% above national average
The Real Cost of Living in Richland, WA for 2026
| Tier | Individual | Family (4) |
|---|---|---|
| Survival | $22k | $42k |
| Comfortable | $78k | $115k |
| Luxury | $165k+ | $256k+ |
| Elite (Top 5%) | $195k+ | $301k+ |
81%
The Area Signal
A metric tracking the socioeconomic signals of the area.
Hobbies
Explore the areaGroceries
7 within 10 miles
Gas
20 within 10 miles
Hospital
7 within 20 miles
Airport
SEA — Seattle–Tacoma International
Post Office
USPS — Richland, WA
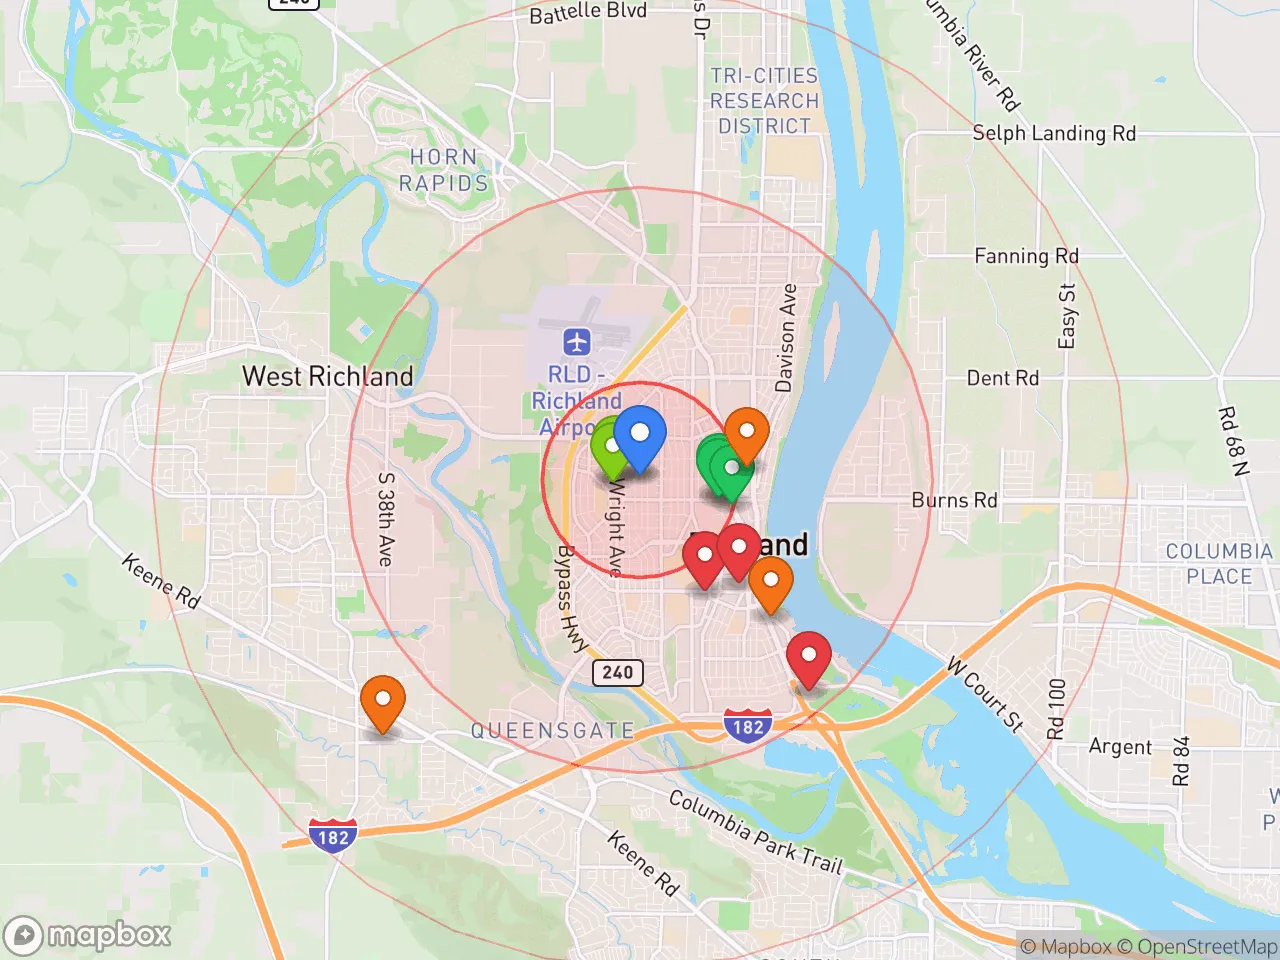
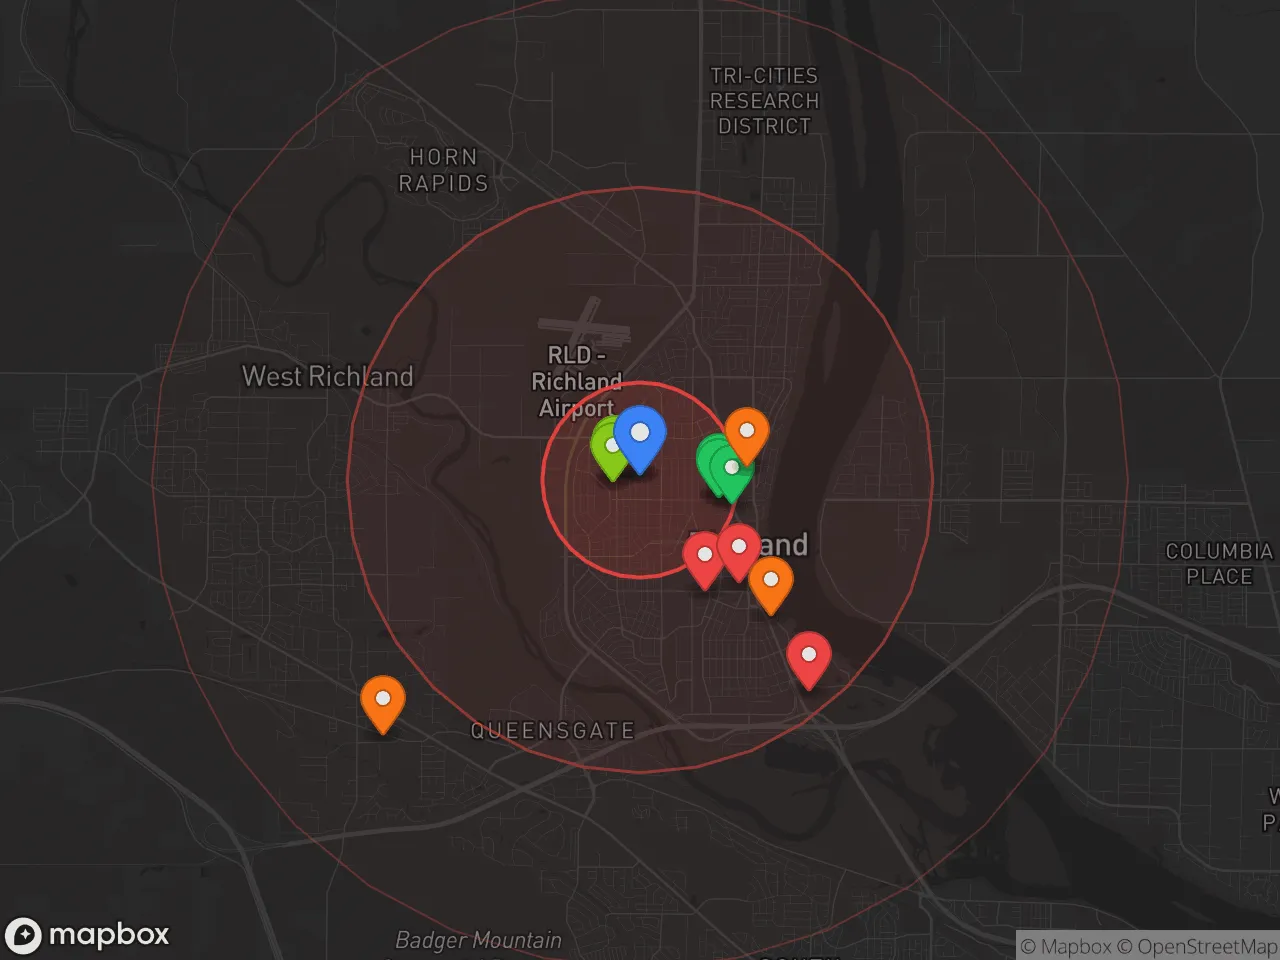
Critical Amenities
Quality-of-Life Analysis
Richland, Washington, presents a quality of life defined by its role as a hub for the Tri-Cities region’s science and engineering workforce, with a cost of living index of 129—well above the national average of 100—and a median home value of $401,800. The city attracts a demographic of professionals, families, and retirees drawn to the Hanford Site, Pacific Northwest National Laboratory (PNNL), and the area’s growing tech and healthcare sectors. This affluence is reflected in a median rent of $1,397 and an average commute of just over 20 minutes, offering a balance of economic opportunity and manageable daily travel that appeals to those seeking a stable, suburban lifestyle in southeastern Washington.
Cost of living and housing affordability compared to nearby areas
Richland’s cost of living index of 129 is significantly higher than the national average, driven primarily by housing costs. The median home value of $401,800 is roughly 10-15% above the Tri-Cities metro average, placing it above neighboring Kennewick ($360,000) and Pasco ($340,000) but still below Seattle-area suburbs like Bellevue ($1.4 million). Renters face a median of $1,397 per month, which is competitive for the region but still 20% higher than in Pasco. The average commute of 20.3 minutes is notably shorter than the national average of 26 minutes, a direct benefit of Richland’s compact layout and proximity to major employers like PNNL and Kadlec Regional Medical Center. For buyers, property taxes in Benton County average about 1.1% of assessed value, lower than Washington’s state average of 0.93%, though the higher home prices offset this advantage. Overall, affordability is a trade-off: residents pay a premium for access to well-funded schools and low crime rates, but the commute savings and local wage growth—especially in STEM fields—help justify the cost.
What daily life is like for families: schools, parks, and local amenities
Daily life in Richland centers on a family-oriented rhythm supported by strong public schools, extensive parks, and a calendar of community events. The Richland School District consistently ranks among the top in Washington, with schools like Richland High School and Hanford High School earning 8-9 out of 10 on GreatSchools ratings, and the district’s graduation rate exceeding 90%. The city maintains over 30 parks, including the 40-acre Howard Amon Park along the Columbia River, which features a marina, playgrounds, and walking trails. For recreation, the nearby Badger Mountain Centennial Preserve offers 15 miles of hiking trails with panoramic views of the Tri-Cities. The local economy is anchored by the Hanford Site and PNNL, which employ over 10,000 workers, creating a stable job market that keeps unemployment below 5%. Dining and shopping are concentrated along the Columbia Center Boulevard corridor, with national chains and local spots like the Foodies Bistro. The city’s low crime rate—violent crime is about 60% below the national average—and the 20-minute average commute mean families spend less time commuting and more time at parks, school events, or on the river. Cultural amenities are limited compared to larger metros, but the Richland Community Center and the annual Tri-Cities Water Follies provide consistent local engagement.
Richland is best suited for professionals and families who prioritize short commutes, high-performing schools, and a safe, suburban environment over urban nightlife or extreme affordability. The city’s strong STEM job base makes it particularly attractive for engineers, scientists, and healthcare workers, while retirees appreciate the low crime and access to the Columbia River. Those seeking a lower cost of living may prefer Pasco or Kennewick, but Richland’s combination of economic stability, educational quality, and manageable daily logistics creates a compelling quality of life for its target demographic.
Crime in Richland, WA
Generally safer than 68% of comparable U.S. locations.
Violent CrimeViolent Crime Analysis
Property CrimeProperty Crime Analysis
Crime Analysis
Richland, Washington, reports a violent crime rate of 255.8 incidents per 100,000 residents and a property crime rate of 2,025.3 per 100,000, placing it in a middle tier for safety within the Tri-Cities metro area. While these figures are lower than the national average for property crime, the violent crime rate is slightly above the Washington state average, a concern amplified by the region's proximity to larger metro areas like Seattle and Portland. The broader judicial environment in Washington, influenced by progressive policies and district attorneys who prioritize alternatives to incarceration, raises legitimate questions about recidivism and public safety for Richland residents.
Crime in context
Richland's violent crime rate of 255.8 per 100,000 is roughly 27% lower than the national average of about 380 per 100,000, but it exceeds the Washington state average of approximately 290 per 100,000. Property crime in Richland, at 2,025.3 per 100,000, is about 15% below the national average of 2,362 per 100,000. However, these statistics must be viewed within the state's broader criminal justice framework. Washington has seen a trend toward progressive prosecution, with some county prosecutors adopting policies that reduce felony charges for certain thefts and drug offenses. This approach, while intended to reduce incarceration, can result in more offenders remaining on the street, directly impacting property crime rates and the sense of security in communities like Richland.
What residents experience
Residents of Richland report that property crimes—particularly vehicle break-ins, theft from porches, and bicycle theft—are the most common safety concerns in daily life. The city's layout, with its many residential cul-de-sacs and parks, can create a false sense of security, as property crime often clusters near commercial corridors like George Washington Way and the Uptown Shopping Center. Violent crime, while less frequent, is not absent; incidents are often concentrated in specific areas and can involve domestic disputes or alcohol-related altercations. The presence of a progressive district attorney in Benton County, who has emphasized diversion programs and reduced sentences for non-violent offenders, means that repeat property offenders may cycle through the system quickly, a pattern that frustrates residents who see the same individuals committing crimes in their neighborhoods.
Neighborhood-level variation is notable in Richland. The older, established areas near the Columbia River and the historic downtown tend to have lower crime rates, while newer developments on the city's periphery and areas closer to the border with Pasco see higher incident reports. The city's overall safety profile is better than that of nearby Kennewick or Pasco, but the influence of progressive judicial policies across the state means that Richland residents cannot assume their low crime rates are permanent. Vigilance in securing property and awareness of local crime patterns remain essential for anyone considering a move to this Tri-Cities community.
* Values derived from national, state, county, city and local statistics and may differ in a specific area. Last updated: 2026-04-21T10:57:46.000Z
Narrative content on this page is AI-generated and may contain mistakes. Verify any details that matter before acting on them.
ReloMaps may earn a commission from affiliate links at no extra cost to you.