
Photo: Wikipedia
Quality of Life in Riverside, CA
A high quality of life with strong walkability, manageable living costs, healthy neighborhood signals, and solid amenity access.
What does Quality of Life tell us?
Quality of Life blends cost of living, nearby amenities, socioeconomic signals, and neighborhood character. City-level scores represent the whole municipality; individual neighborhoods can differ.
What does this tell us?
Quality of Life blends cost of living, nearby amenities, socioeconomic signals, and neighborhood character. City-level scores represent the whole municipality; individual neighborhoods can differ.
Cost of Living
70% above national average
The Real Cost of Living in Riverside, CA for 2026
| Tier | Individual | Family (4) |
|---|---|---|
| Survival | $29k | $54k |
| Comfortable | $95k | $139k |
| Luxury | $139k+ | $215k+ |
| Elite (Top 5%) | $163k+ | $253k+ |
64%
The Area Signal
A metric tracking the socioeconomic signals of the area.
Hobbies
Explore the areaGroceries
8 within 10 miles
Gas
20 within 10 miles
Hospital
20 within 20 miles
Airport
SAN — San Bernardino International
Post Office
USPS — Riverside, CA
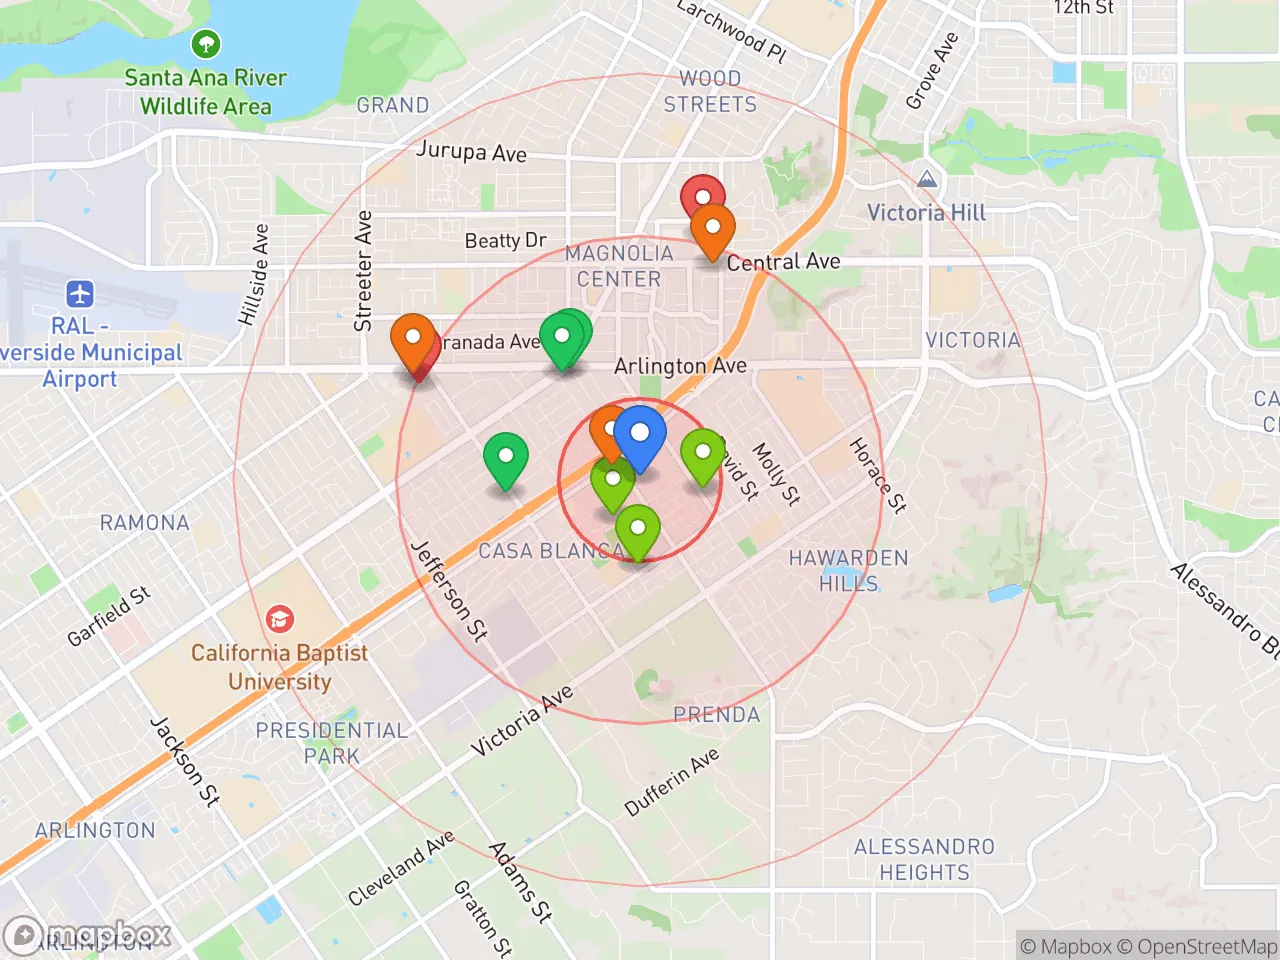
Critical Amenities
Quality-of-Life Analysis
Riverside, California, presents a quality of life shaped by its position as an inland anchor of the Inland Empire, offering a more attainable cost of living than coastal Los Angeles or Orange County while retaining a distinct, historic character. The area attracts a diverse mix of families, commuters, and university-affiliated residents, with a population that is roughly 52% Hispanic or Latino, 28% non-Hispanic White, and 7% Asian, reflecting its role as a regional hub for both working professionals and students at the University of California, Riverside. Affluence is moderate and unevenly distributed, with a median household income around $72,000, significantly below the state average, meaning many households are cost-burdened despite the lower relative prices compared to the coast.
Cost of living and housing affordability compared to Los Angeles and Orange County
Riverside's overall cost of living index stands at 170 (100 equals the U.S. average), which is notably lower than Los Angeles County's index of roughly 180-190 and Orange County's 200+, but still far above the national baseline. The median home value is $542,100, a figure that is roughly half the median in Los Angeles County and about 40% less than in Orange County, making homeownership more accessible for dual-income households. Median rent is $1,812, which undercuts the Los Angeles metro average by approximately $400 per month, though it has risen 35% since 2020, squeezing renters. The average commute time is 31.6 minutes, slightly above the national average, driven by the large number of residents who drive west to jobs in Orange County or Los Angeles via the congested 91 and 60 freeways, a trade-off for lower housing costs.
Schools, amenities, and the daily rhythm of life in the Inland Empire
Daily life in Riverside revolves around a mix of suburban convenience and historic downtown activity, anchored by the Mission Inn and the pedestrian-friendly Main Street pedestrian mall, which hosts a weekly farmers market and frequent festivals. The Riverside Unified School District serves most of the city, with several schools rated above the state average, including Riverside STEM Academy, consistently ranked among California's top high schools. For higher education, UC Riverside provides cultural events, research facilities, and a 1,200-acre campus that doubles as a botanical garden. Amenities include the 450-acre Fairmount Park, the Riverside Art Museum, and the Fox Performing Arts Center, but residents often drive 20-30 minutes for major shopping or specialized healthcare, as the city lacks the density of coastal retail corridors. The climate is semi-arid, with over 280 sunny days per year and summer highs frequently exceeding 100°F, which shapes outdoor activity patterns toward early morning or evening hours.
Riverside is best suited for households that prioritize space and a lower purchase price over proximity to the coast, particularly commuters who can tolerate a 30- to 45-minute drive to Orange County jobs. Families with children will find a solid public school system and a slower pace than Los Angeles, while UC Riverside students and faculty benefit from the university's amenities and relatively affordable off-campus housing. Retirees on fixed incomes may struggle with the rising rent and utility costs in summer, but those who bought before 2020 enjoy significant equity gains. Anyone seeking a vibrant nightlife or walkable urban core should look elsewhere, as Riverside's appeal lies in its balance of cost, climate, and community scale rather than cosmopolitan energy.
Crime in Riverside, CA
WARNING: The crime statistics are unreliable for this jurisdiction. Local authorities have either not reported or under reported their data to the FBI. This could be due to bad intentions, incompetence or technical issues. Regardless, we suggest skepticism.
Significantly higher crime rates than 75% of comparable U.S. locations.
Violent CrimeViolent Crime Analysis
Property CrimeProperty Crime Analysis
Crime Analysis
Riverside, California, presents a crime and safety profile that warrants careful consideration, particularly for those relocating from lower-crime regions. The city's violent crime rate stands at 529.7 incidents per 100,000 residents, and its property crime rate is 2,168.7 per 100,000, both figures that exceed national averages and signal elevated risk for residents and businesses.
Crime in context
Riverside's violent crime rate is roughly 40% higher than the national average of approximately 380 per 100,000, while its property crime rate surpasses the U.S. average by about 15%. Compared to California's statewide violent crime rate of roughly 500 per 100,000, Riverside is slightly above the state norm. However, these raw numbers only tell part of the story. As part of a large metropolitan area within a state known for progressive criminal justice policies, Riverside operates under legal frameworks that prioritize rehabilitation and reduced incarceration. Critics point to California's Proposition 47 (which reclassified many drug and property felonies as misdemeanors) and local district attorney policies that emphasize diversion programs over prosecution. These approaches, while intended to reduce recidivism, have been linked to higher rates of property crime and a perception that repeat offenders face minimal consequences, directly impacting public safety.
What residents experience
Property crime—including theft, burglary, and motor vehicle theft—is the most common safety concern for Riverside residents. Auto theft rates are notably high, reflecting a statewide trend. Violent crimes, while less frequent, include aggravated assault as the most common category, with robbery and homicide occurring at rates above the national median. Residents often report that property crimes feel under-policed, as limited law enforcement resources are stretched across a sprawling city of over 300,000 people. The presence of progressive district attorneys in Riverside County has led to policies that frequently offer plea deals or pretrial diversion for non-violent offenders, a practice that some argue keeps habitual criminals on the streets and erodes deterrence. For families and retirees, this translates to a heightened need for home security systems, neighborhood watch participation, and vigilance in parking and storage habits.
Neighborhood-level variation
Safety in Riverside varies significantly by neighborhood. Areas like Wood Streets, Canyon Crest, and Orangecrest report substantially lower crime rates, benefiting from higher home values, active homeowners associations, and private security patrols. In contrast, neighborhoods such as Eastside, Arlanza, and parts of downtown experience higher concentrations of both property and violent crime, often correlated with lower median incomes and higher population density. The University of California, Riverside campus area has its own police force and generally lower crime, though off-campus student housing sees elevated theft and burglary. Prospective residents should research specific block-level crime maps and consider that even in safer neighborhoods, the broader county's progressive justice policies mean that offenders apprehended elsewhere may still be released quickly, affecting the entire city's safety climate.
* Values derived from national, state, county, city and local statistics and may differ in a specific area. Last updated: 2026-04-29T21:30:54.000Z
Narrative content on this page is AI-generated and may contain mistakes. Verify any details that matter before acting on them.
ReloMaps may earn a commission from affiliate links at no extra cost to you.