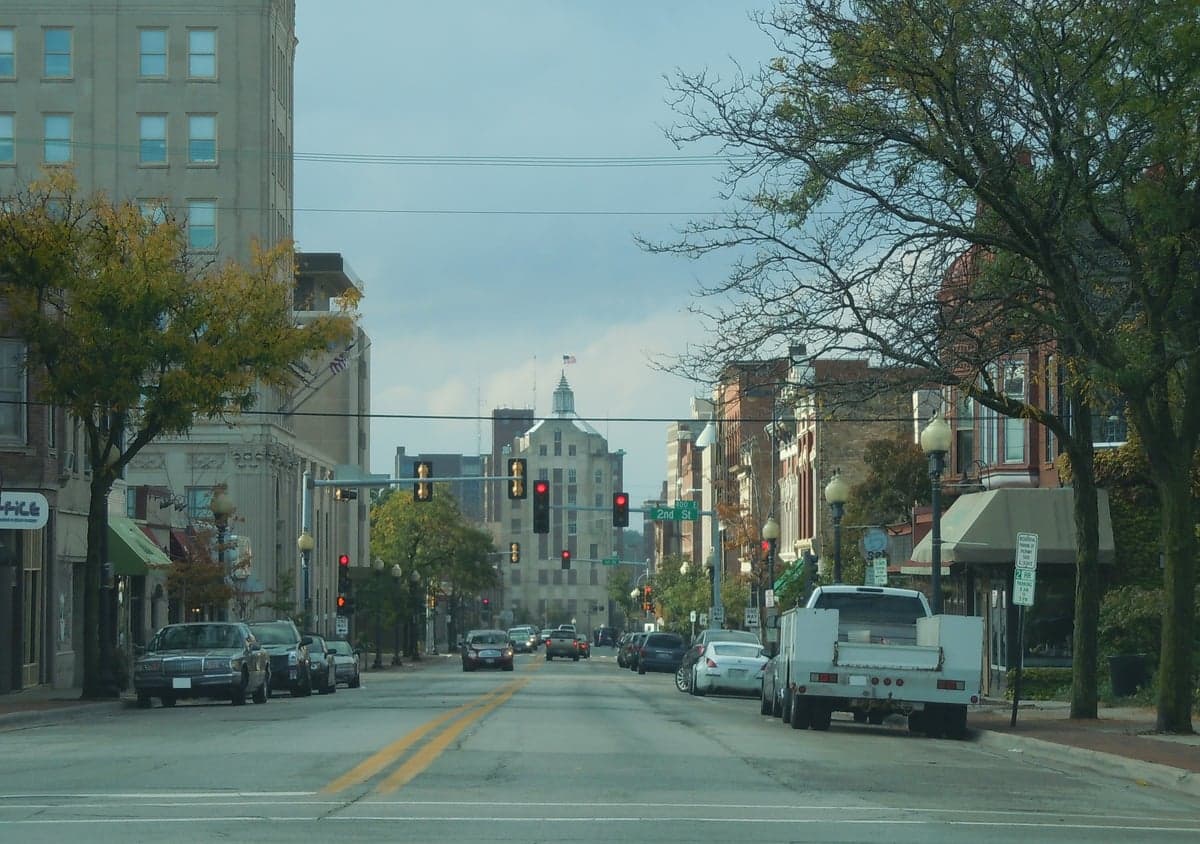
Photo: Wikipedia
Demographics of Rockford, IL
Affluence Level in Rockford, IL
A below-average socioeconomic profile. Incomes, home values, and educational attainment trail the U.S., with higher poverty and unemployment.
People of Rockford, IL
The people of Rockford, IL today number 147,649, making it the third-largest city in Illinois, with a population density of roughly 2,700 people per square mile. The city is a majority-minority community where no single racial or ethnic group holds a numerical majority: White residents make up 50.1% of the population, Hispanic residents 20.6%, Black residents 21.1%, and East/Southeast Asian residents 2.9%, with a small Indian-subcontinent community at 0.7%. The foreign-born share stands at 6.8%, below the national average, and the college-educated rate is 23.2%, reflecting a working-class industrial heritage that is slowly diversifying. Rockford’s identity is one of a former manufacturing powerhouse in transition, with a population that is older, less transient, and more rooted than many Midwestern peers.
How the city was settled and grew
Rockford’s original population was drawn by the waterpower of the Rock River, which attracted Yankee settlers from New England and New York in the 1830s and 1840s. These early arrivals founded the city as a milling and agricultural center, and by the 1850s, Swedish immigrants began arriving in large numbers, recruited by railroad companies and land agents. The Swedish community concentrated in the Church Street corridor and the near-west side, building institutions like the Swedish American Hospital and the First Lutheran Church. A second major wave came from Italy and Poland between 1890 and 1920, with Italian immigrants settling in the “Little Italy” district around 7th Street and 11th Street, and Polish families clustering in the northeast side near the St. Stanislaus Kostka Church. These groups were drawn by jobs in the city’s booming furniture factories, machine shops, and the Rockford Watch Company, which made Rockford a national center for precision manufacturing. By 1920, the city was overwhelmingly white, with a small Black population (under 2%) that lived near the railroad yards in the Ellis Street area.
Modern era (post-1965)
The post-1965 era reshaped Rockford’s population dramatically. The Immigration and Nationality Act of 1965 opened doors for new arrivals, but the city’s biggest demographic shift came from domestic migration. Between 1970 and 2000, Rockford lost roughly 20% of its white population to suburbanization, while the Black share grew from 8% to over 20%, driven by African Americans moving from Chicago and the Deep South for manufacturing jobs. These families settled primarily in the west side and southwest side, particularly around the Fairgrounds neighborhood and the Blackhawk Courts area. Hispanic migration accelerated in the 1990s and 2000s, with Mexican and Puerto Rican families arriving for work in the remaining factories and the logistics sector. The Hispanic community concentrated in the southeast side and the 11th Street corridor, creating a vibrant commercial strip of taquerias and bodegas. East/Southeast Asian communities—primarily Hmong refugees from Laos and Vietnamese families—arrived in the 1980s and 1990s, settling in the northeast side near the Rockford Mall and around Alpine Road. The Indian-subcontinent population remains small (0.7%) and is largely professional, drawn by jobs at Rockford’s hospitals and engineering firms, with no single ethnic enclave.
The future
Rockford’s population is slowly declining—down from a peak of 152,871 in 2010—and the trend is toward greater racial and ethnic balkanization rather than homogenization. The white population is aging and shrinking, while the Hispanic share is growing steadily, projected to reach 25-28% by 2040. Black population growth has plateaued, and East/Southeast Asian communities are stable but not expanding rapidly. The foreign-born share (6.8%) is unlikely to rise sharply, as Rockford lacks the gateway-city infrastructure of Chicago or the job growth of the Sun Belt. The city is tribalizing into distinct enclaves: the west side remains predominantly Black, the southeast side is heavily Hispanic, and the northeast and far northwest sides are majority white. For a new resident, this means choosing a neighborhood that aligns with their cultural and practical preferences—the northeast side offers the most diverse housing stock and schools, while the southeast side provides the strongest Hispanic community infrastructure.
Bottom-line: Rockford is becoming a more Hispanic and more stratified city, with a shrinking white base and a stable Black population. The city’s industrial past is fading, and its future depends on whether it can attract and retain younger, college-educated residents—currently only 23.2% hold a degree. For a conservative-leaning mover, Rockford offers affordable housing and a slower pace of life, but the demographic trends mean that the city’s political and cultural character will continue to shift toward a more diverse, working-class identity.
* Values derived from national, state, county, city and local statistics and may differ in a specific area. Last updated: 2026-04-29T20:35:31.000Z
Narrative content on this page is AI-generated and may contain mistakes. Verify any details that matter before acting on them.
ReloMaps may earn a commission from affiliate links at no extra cost to you.