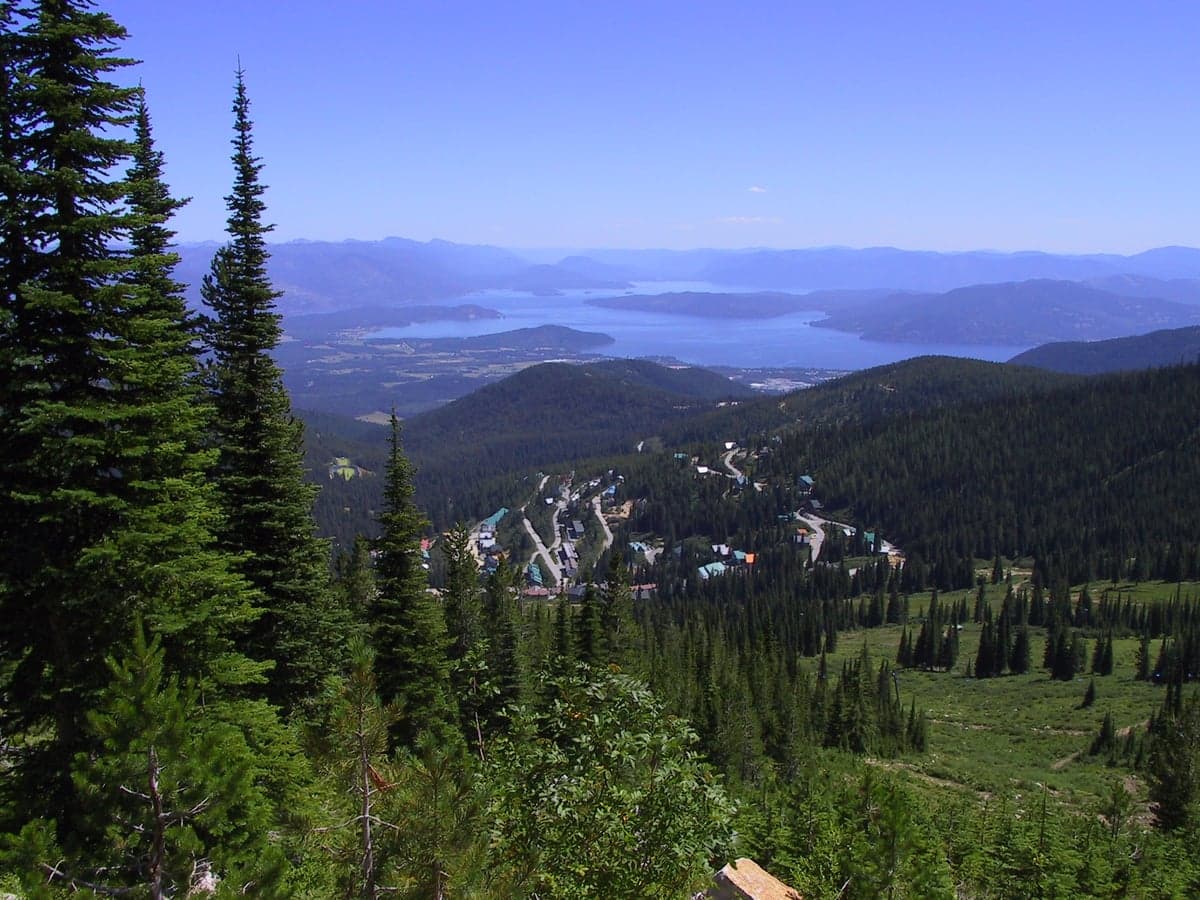
Photo: Wikipedia
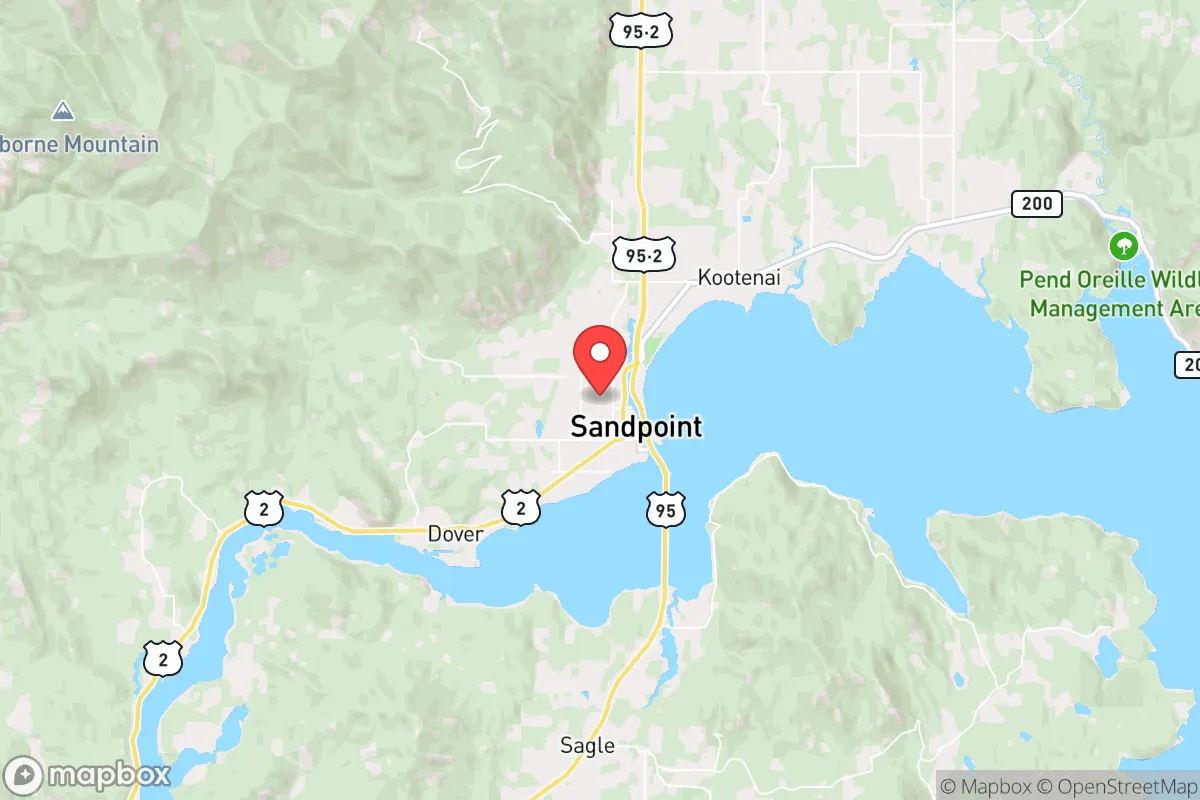
Demographics of Sandpoint, ID
Affluence Level in Sandpoint, ID
A middle-class area roughly in line with national averages across income, home values, education, and employment.
People of Sandpoint, ID
The people of Sandpoint, Idaho today number roughly 9,244, forming a predominantly white (86.1%) community with a small but notable Hispanic population (7.8%) and a very low foreign-born share of just 2.6%. The city carries a distinctive character as a tight-knit, outdoors-oriented mountain town where 38.3% of adults hold a college degree, a figure that reflects an influx of remote workers and retirees drawn by the natural setting. Sandpoint’s population is notably less diverse than the national average, with East/Southeast Asian residents at 0.8%, Indian subcontinent residents at 0.2%, and Black residents at 0.3%, creating a demographic profile that is both stable and slowly shifting.
How the city was settled and grew
Sandpoint’s human history begins with the Kalispel and Kootenai tribes, who used the shores of Lake Pend Oreille as seasonal fishing and trading grounds long before European contact. Permanent white settlement began in the 1880s with the arrival of the Northern Pacific Railway, which selected the site as a division point and depot. The railroad drew a wave of Irish, German, and Scandinavian laborers who built the original downtown core around what is now First Avenue and Cedar Street, constructing simple wood-frame homes in the Lakeview Park neighborhood. By 1900, the town’s economy centered on timber and rail, attracting loggers and mill workers from the Upper Midwest. A second wave came during the 1910s and 1920s as homesteaders took up land under the federal Homestead Act, settling the Ponderosa Springs area east of town. These early populations were overwhelmingly Northern European, and the city’s ethnic makeup remained nearly all-white through the mid-20th century. The 1950 census recorded Sandpoint’s population at roughly 4,000, with no significant non-white presence.
Modern era (post-1965)
The post-1965 period brought little of the immigration-driven diversification seen in larger U.S. cities. Sandpoint’s foreign-born population remains low at 2.6%, and the city did not experience the suburbanization patterns common in the Sun Belt. Instead, the major demographic shift after 1965 was domestic in-migration: retirees and second-home buyers from California, Washington, and Oregon began arriving in the 1970s and 1980s, drawn by Schweitzer Mountain Resort and the lake. These newcomers concentrated in the Schweitzer Mountain area and the Kootenai Shores subdivision along the lake’s western shore, building larger homes and raising the median income. The Hispanic population, now 7.8%, grew primarily through agricultural and construction labor from Mexico and Central America, settling in the Ponderay area just south of Sandpoint proper. East/Southeast Asian residents (0.8%) are a small presence, largely professionals in healthcare and tech, while the Indian subcontinent population (0.2%) is negligible. The Black population (0.3%) remains tiny, reflecting the region’s historic lack of industrial or military draws that attracted Black families elsewhere. The city’s white share (86.1%) has declined slightly from near 95% in 1990, driven almost entirely by Hispanic growth.
The future
Sandpoint’s population is heading toward modest diversification, but the pace is slow. The Hispanic share is likely to continue rising gradually as families in the Ponderay corridor grow and as service-sector jobs in tourism and construction attract new arrivals. The East/Southeast Asian and Indian subcontinent populations are expected to remain small, as the city lacks the professional job base or university presence that draws these groups to larger metros. The white population, while still dominant, is aging: many retirees who moved here in the 1980s and 1990s are now in their 70s and 80s, and their homes are increasingly being purchased by younger remote workers from coastal states, a trend that may slowly raise the college-educated share above 38.3%. The city is not tribalizing into distinct ethnic enclaves; rather, it is homogenizing around a shared outdoor lifestyle, with the main divide being between long-time locals and newer arrivals rather than racial lines. The foreign-born share (2.6%) is unlikely to rise sharply given the area’s limited affordable housing and lack of large employers.
For someone moving to Sandpoint now, the city offers a stable, predominantly white community with a growing Hispanic minority and very little racial diversity beyond that. The population is becoming slightly more educated and more affluent as remote workers replace retirees, but the overall character remains that of a small mountain town where newcomers are expected to assimilate into the existing culture rather than reshape it. The low crime rate, strong schools, and outdoor recreation are the primary draws, and the demographic trajectory suggests these features will persist for the next decade at least.
* Values derived from national, state, county, city and local statistics and may differ in a specific area. Last updated: 2026-04-21T09:14:03.000Z
Narrative content on this page is AI-generated and may contain mistakes. Verify any details that matter before acting on them.
ReloMaps may earn a commission from affiliate links at no extra cost to you.