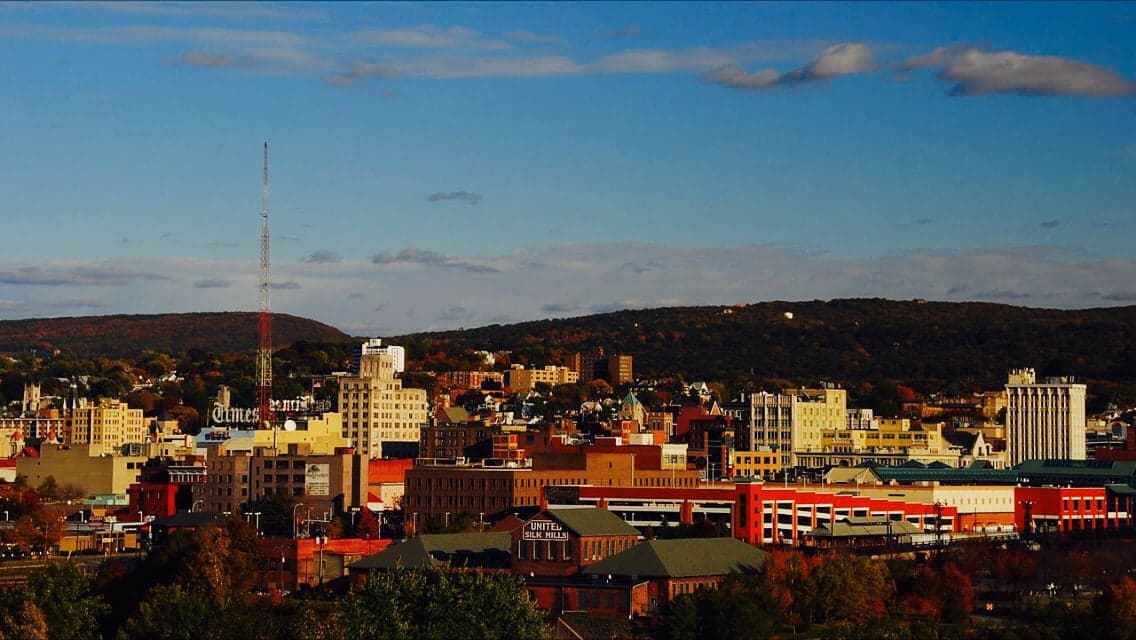
Photo: Wikipedia
Demographics of Scranton, PA
Affluence Level in Scranton, PA
A low-income area with significant economic hardship. Household wealth and educational attainment are well below national averages.
People of Scranton, PA
The people of Scranton, Pennsylvania today number 76,074, making it a mid-sized city with a dense, working-class character rooted in its industrial past. The population is predominantly White (68.0%), with a significant Hispanic minority (16.5%), a smaller Black community (6.4%), and growing Indian-subcontinent (3.1%) and East/Southeast Asian (1.6%) populations. Only 22.8% of adults hold a college degree, reflecting a blue-collar identity that persists even as the city transitions away from its coal-and-railroad heyday.
How the city was settled and grew
Scranton’s population history is defined by successive waves of European immigration drawn by anthracite coal and heavy industry. The city was incorporated in 1866, but its growth exploded after the discovery of coal in the Lackawanna Valley. The first major wave came from Ireland and Germany in the 1840s–1860s, settling in the Green Ridge and Hyde Park neighborhoods, where they built the churches and saloons that anchored early community life. By the 1880s, Welsh miners arrived, concentrating in Dunmore (a borough now contiguous with the city) and the West Side, bringing their own chapels and strong union traditions. The largest wave, however, was Italian and Eastern European (Polish, Slovak, Lithuanian, Ukrainian) immigration between 1890 and 1920. These groups settled in dense, ethnic enclaves: Italians dominated the Hill Section (around Providence Road) and the Plot neighborhood near the railroad yards, while Poles and Slovaks clustered in South Side and East Scranton. By 1920, Scranton’s population peaked at 143,000, making it one of the most ethnically diverse cities in Pennsylvania, with dozens of parishes and mutual-aid societies serving distinct groups.
Modern era (post-1965)
After the 1965 Hart-Cellar Act, Scranton’s immigration patterns shifted dramatically. The city’s industrial base collapsed—coal mining ended by the 1960s, and the Lackawanna Railroad declined—triggering a half-century of population loss. The White population shrank from over 95% in 1970 to 68.0% today, driven by suburban flight to the Abingtons and Lackawanna County suburbs. The most notable post-1965 arrival has been the Hispanic community, primarily Puerto Rican and Dominican, who began settling in the 1980s and 1990s. They concentrated in the West Side and South Side, areas with older, affordable housing stock and proximity to service jobs. Today, the Hispanic population is 16.5% and continues to grow, with a visible presence on Birney Avenue and Capouse Avenue commercial corridors. The Indian-subcontinent community (3.1%) arrived more recently, largely after 2000, drawn by lower housing costs and the presence of the University of Scranton and Geisinger Commonwealth Medical College. They are concentrated in the Hill Section and Green Ridge, near the universities. The East/Southeast Asian population (1.6%) is smaller and more dispersed, with a cluster of Vietnamese and Korean families in East Scranton. The Black population (6.4%) is largely native-born, with roots in the Great Migration of the 1940s–1960s, and remains concentrated in the West Side and South Side.
The future
Scranton’s population is slowly stabilizing after decades of decline, but it is not homogenizing. The White population is aging and shrinking, while the Hispanic share is rising steadily, projected to reach 20–22% by 2035 based on current birth rates and migration. The Indian-subcontinent community is growing, driven by medical and tech professionals, and is likely to expand into the Hill Section and Green Ridge as housing turnover occurs. The East/Southeast Asian population is plateauing, with little new immigration. The city is becoming more tribalized: neighborhoods like the West Side are increasingly Hispanic, while the Hill Section is becoming a multi-ethnic corridor of Indian, Italian, and young professional households. The South Side remains the most diverse, with Black, Hispanic, and White families living in close proximity. For a new resident, this means Scranton offers distinct, walkable neighborhoods with strong ethnic identities, but also persistent economic challenges—low educational attainment and a tax base that struggles to fund schools and infrastructure.
Scranton is becoming a smaller, more diverse, and more Hispanic city, with a growing Indian-subcontinent professional class and a stable East/Southeast Asian minority. For a conservative-leaning mover, the city offers affordable housing, strong Catholic and union traditions, and a slower pace of life, but also a population that is increasingly younger and more ethnically varied than the surrounding Lackawanna County suburbs. The next decade will likely see continued Hispanic growth, Indian-subcontinent expansion near the universities, and a slow decline in the White share—a demographic reality that makes Scranton a genuinely multi-ethnic city in a region that remains largely White and rural.
* Values derived from national, state, county, city and local statistics and may differ in a specific area. Last updated: 2026-05-01T23:24:44.000Z
Narrative content on this page is AI-generated and may contain mistakes. Verify any details that matter before acting on them.
ReloMaps may earn a commission from affiliate links at no extra cost to you.