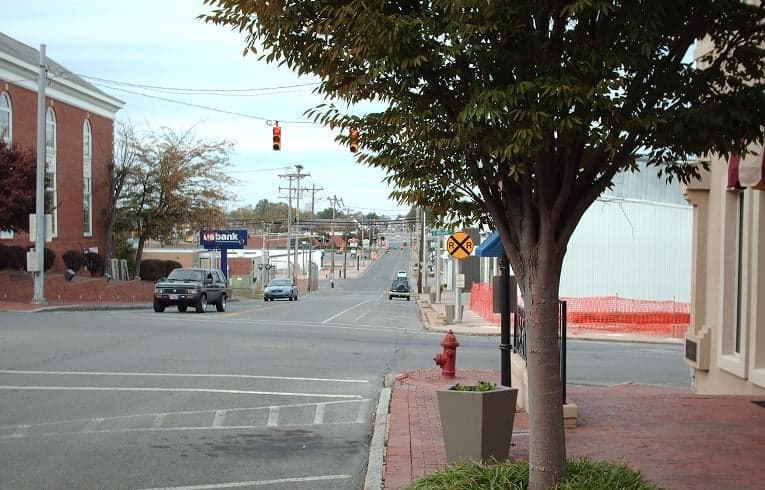

Photo: Wikipedia
Demographics of Shelbyville, TN
Affluence Level in Shelbyville, TN
A below-average socioeconomic profile. Incomes, home values, and educational attainment trail the U.S., with higher poverty and unemployment.
People of Shelbyville, TN
The people of Shelbyville, Tennessee today form a working-class, majority-minority community of 24,125 residents, defined by a significant Hispanic population that now makes up nearly a third of the city. With a college attainment rate of just 11.6% — well below state and national averages — the population is predominantly employed in manufacturing, logistics, and agriculture. The city's distinctive identity is shaped by its role as a regional industrial hub, a legacy of poultry processing and automotive parts production that has drawn successive waves of domestic and international migrants.
How the city was settled and grew
Shelbyville was founded in 1810 as the seat of Bedford County, named after Revolutionary War General Isaac Shelby. The original settlers were primarily Scots-Irish and English farmers from Virginia and North Carolina, drawn by the fertile limestone soils of the Duck River Valley. These early families established the Central Business District around the historic courthouse square, with residential development spreading along North Main Street and South Main Street. By the mid-19th century, the city became a regional trading center for cotton and livestock, with the Fairfield neighborhood emerging as a prosperous enclave for merchants and landowners. The arrival of the Nashville and Chattanooga Railroad in 1852 accelerated growth, bringing German and Irish laborers who settled in the West Side near the rail yards. The city's population remained overwhelmingly white and native-born through the early 20th century, with a small Black community concentrated in the East Side neighborhood along Lane Parkway, descendants of enslaved people who remained after the Civil War.
Modern era (post-1965)
The 1965 Hart-Cellar Immigration Act reshaped Shelbyville's demographics dramatically. The city's poultry processing plants — particularly the Tyson Foods facility — began actively recruiting Mexican and Central American workers in the 1970s and 1980s, creating the foundation for today's 29.2% Hispanic population. These immigrant families initially settled in the Southgate neighborhood near the industrial parks, where affordable housing and proximity to the plants made it a natural landing point. By the 1990s, a second wave of Hispanic migrants had established a commercial corridor along Madison Street, with tiendas, taquerias, and bodegas serving a growing community. The white population, which had been over 90% as recently as 1970, declined steadily through out-migration to suburban communities like Murfreesboro and Franklin. The Black population, now 11.7%, remained relatively stable but shifted from the historic East Side to newer subdivisions in the Northgate area. The foreign-born share reached 11.1% by 2020, nearly all of Hispanic origin — East/Southeast Asian communities are essentially absent at 0.0%, and Indian-subcontinent residents number just 0.2%.
The future
Shelbyville's population is trending toward a Hispanic-majority future, likely within the next 10-15 years. The white population, now 54.0%, is aging and declining through both out-migration and natural decrease, while the Hispanic population is younger and has higher fertility rates. The city is not tribalizing into distinct enclaves so much as experiencing a gradual demographic replacement: the West Side and Central Business District remain predominantly white and older, while Southgate and the Madison Street corridor are overwhelmingly Hispanic. The Black population is plateauing, with little new in-migration. The immigrant community is not assimilating rapidly — Spanish remains dominant in many households, and the low college attainment rate (11.6%) suggests limited upward mobility. The next decade will likely see continued Hispanic growth, further white flight to surrounding rural areas, and a city government increasingly responsive to a Spanish-speaking electorate.
For someone moving in now, Shelbyville is becoming a predominantly Hispanic working-class city with a shrinking white minority and a stable Black community. The economy remains anchored in low-skill manufacturing, and the population is young but undereducated. New residents should expect a community where English is increasingly secondary in daily commerce, where the school system faces challenges of language acquisition and poverty, and where the civic culture is shifting from its historic Southern roots toward a bicultural identity.
* Values derived from national, state, county, city and local statistics and may differ in a specific area. Last updated: 2026-05-01T14:40:15.000Z
Narrative content on this page is AI-generated and may contain mistakes. Verify any details that matter before acting on them.
ReloMaps may earn a commission from affiliate links at no extra cost to you.