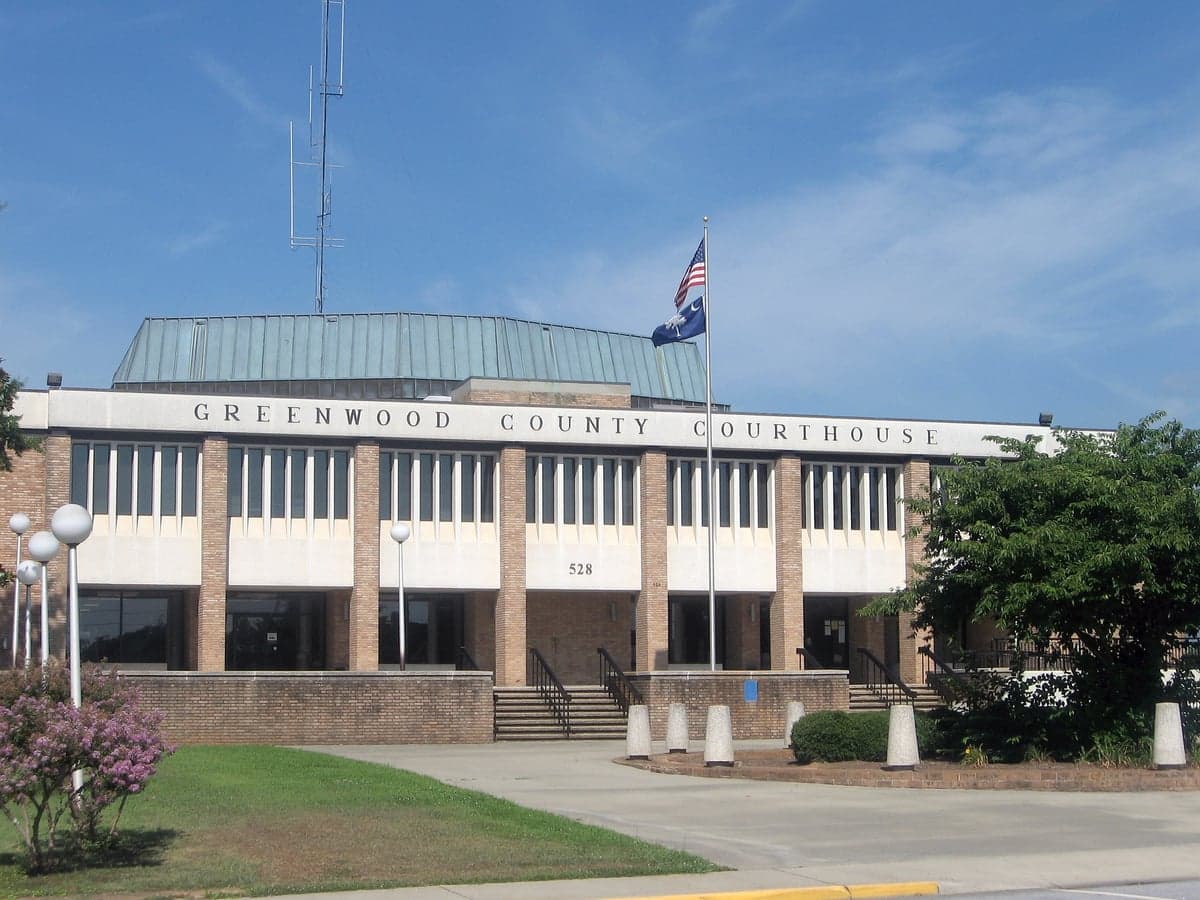
Photo: Wikipedia
Demographics of Greenwood County
Affluence Level in Greenwood County
A middle-class area roughly in line with national averages across income, home values, education, and employment.
People of Greenwood County
Greenwood County’s 69,329 residents form a predominantly Southern community where white (58%) and Black (31%) populations share a deep historic presence, alongside a small but growing Hispanic segment (7%) and barely measurable East/Southeast Asian (0.8%) and Indian-subcontinent (0.2%) groups. With only 2.4% foreign-born and 25.6% college-educated, the county reflects a working-class, rural-to-small-town character anchored by the city of Greenwood and outer towns like Ninety Six, Ware Shoals, and Hodges. Political and cultural identity leans conservative, shaped by generations of textile and agricultural labor.
Settlement & growth (pre-1960)
Before European arrival, the region that became Greenwood County was hunting and trading territory of the Cherokee and Muskogean-speaking Creek peoples. The first white settlers, predominantly Scotch-Irish and English farmers, pushed into the area from the Piedmont of Virginia and North Carolina starting in the 1750s, drawn by fertile land grants along the Saluda River and its tributaries. The village of Ninety Six — named by Cherokee traders for the distance in miles from the Keowee settlement — became a frontier outpost and site of a pivotal Revolutionary War siege in 1781. After the war, settlement expanded south and west, with hamlets like Hodges (originally the Pierce Settlement) and Cokesbury emerging around crossroads churches and small schools.
Cotton cultivation drove antebellum growth, bringing enslaved African labor to plantations along the low ridges. After Emancipation, freedmen concentrated in rural communities such as Promised Land and on the outskirts of Coronaca, where they worked as sharecroppers and tenant farmers. The post-Reconstruction era saw the arrival of textile mills, beginning in the 1880s, that transformed the economy and drew both white and Black rural families into new company towns. Ware Shoals was founded in 1901 as a mill village around the Ware Shoals Manufacturing Company, attracting workers from the surrounding countryside. Similarly, the city of Greenwood — incorporated as a railroad junction in 1852 — boomed as a textile hub, with mills like Greenwood Cotton Mill and Panola Cotton Mill employing thousands by World War I. Troy and Bradley grew as small mill-support nodes. No major immigrant wave reached Greenwood County during this period; the population remained overwhelmingly native-born White and Black, with foreign-born numbers barely above 1% through 1960.
Modern era (post-1965)
The 1965 Hart-Cellar Act had minimal direct impact on Greenwood County. The small 2.4% foreign-born share today includes a modest number of Hispanic laborers — mostly from Mexico and Central America — who began arriving in the 1990s to work in poultry processing (e.g., the Pilgrim’s Pride plant in Greenwood) and in local agriculture. The Hispanic population, now 7%, is concentrated in southern parts of the county and in mobile-home parks on the outskirts of Coronaca and Bradley, but has not formed a distinct ethnic enclave. East/Southeast Asian presence (0.8%) is limited to a scattering of professionals and business owners in Greenwood city, while the Indian-subcontinent share (0.2%) is so small it effectively registers as near nil. Domestic migration, rather than international immigration, has been the larger demographic force: since the 1970s, Greenwood County has drawn retirees and job-seekers from elsewhere in the Southeast, particularly from declining mill towns in North Carolina and Georgia, as well as a slow trickle of northerners seeking a lower cost of living. Black residents remain concentrated in the same historic communities — Promised Land, Ninety Six (especially the East Side), and central Greenwood — though suburban-style developments on the city’s west side have attracted some upwardly mobile Black families. White residents have gravitated toward newer subdivisions around Hodges and along the Lake Greenwood shoreline, where second-home and retirement properties have proliferated since the 1980s.
The future
Greenwood County is not heading toward rapid diversification. The Hispanic segment may grow modestly through births and continued labor recruitment, but it remains too small to reshape cultural identity. The white and Black populations are both aging, with young adults leaving for larger metro areas in the Southeast. In-migration is primarily domestic and overwhelmingly white, drawn by cheap land and the lake lifestyle, but volume is low enough that the county’s demographic profile will change little over the next decade. Instead of tribalizing into new enclaves, existing communities are slowly homogenizing as the textile-era mill village identity fades and a more generic exurban culture emerges. The small East/Southeast Asian and Indian populations will likely remain negligible. For a newcomer, this means moving into a place where the cultural and racial composition is relatively stable, with a conservative political bent and a social fabric still organized around churches, hunting clubs, and high school football.
Greenwood County is becoming a quieter, more pastoral version of its industrial past — a place where the population is steady, the Hispanic share grows incrementally, and the future looks much like the present. For someone moving in now, the appeal lies in predictability, lower taxes, and a community where most residents share a similar background and outlook.
* Values derived from national, state, county, city and local statistics and may differ in a specific area. Last updated: 2026-05-21T00:56:40.000Z
Narrative content on this page is AI-generated and may contain mistakes. Verify any details that matter before acting on them.
ReloMaps may earn a commission from affiliate links at no extra cost to you.