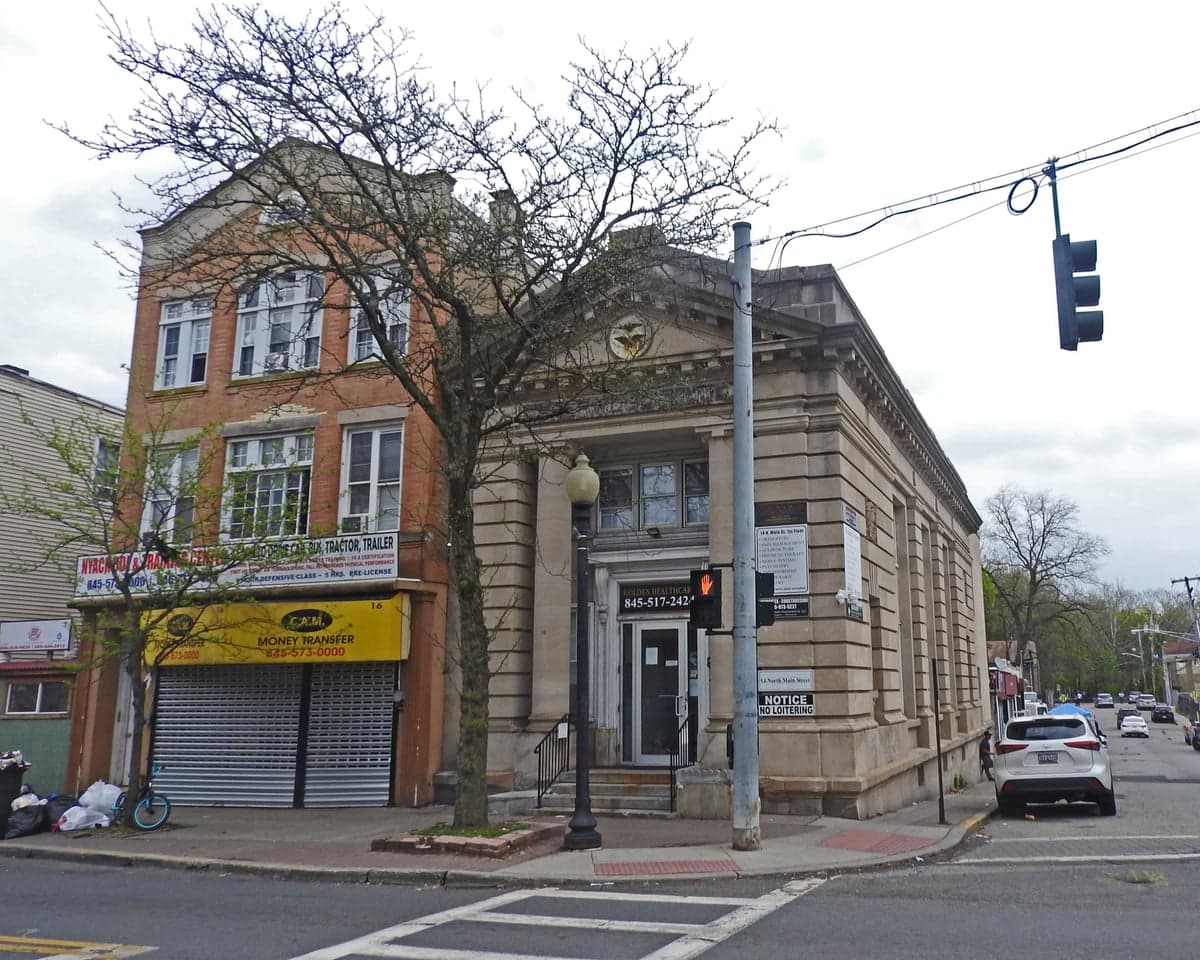
Photo: Wikipedia
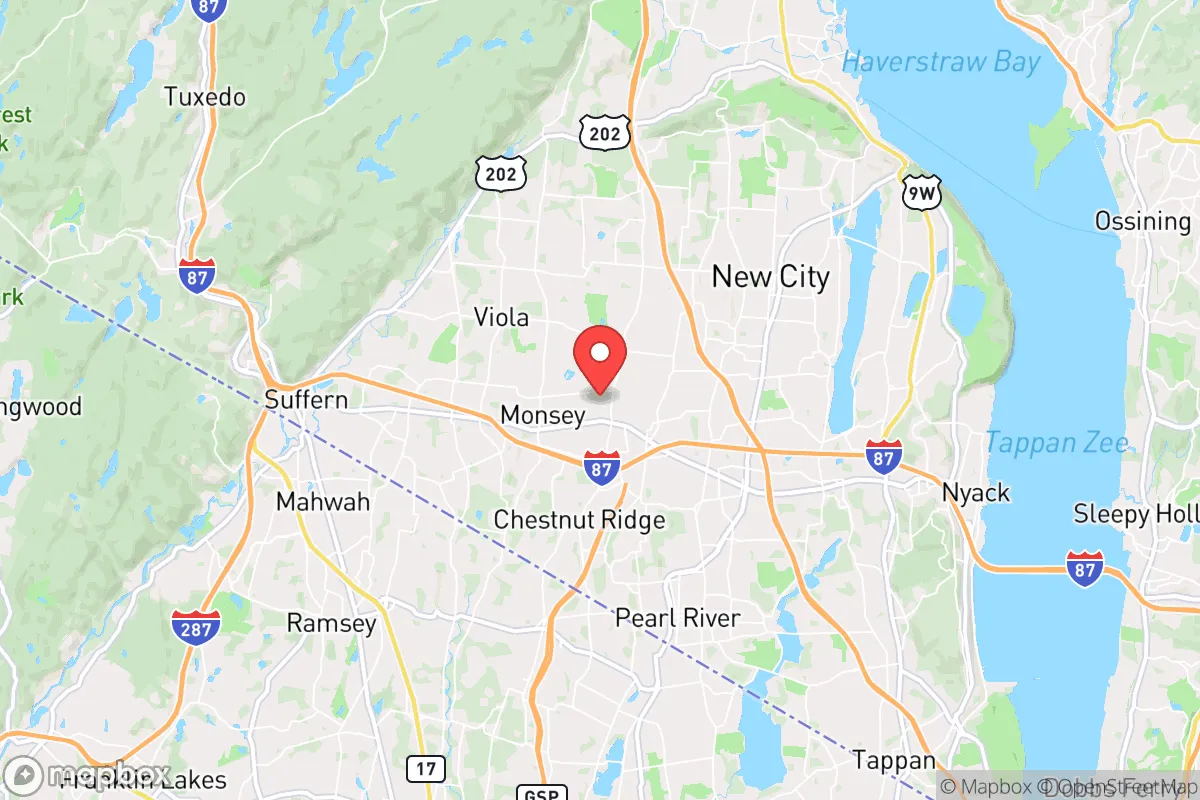
Demographics of Spring Valley, NY
Affluence Level in Spring Valley, NY
A below-average socioeconomic profile. Incomes, home values, and educational attainment trail the U.S., with higher poverty and unemployment.
People of Spring Valley, NY
The people of Spring Valley, New York today form a dense, majority-minority city of 32,995 residents, distinguished by its deep ethnic diversity and a foreign-born population of 25.3%—nearly double the national average. The city is a rare tri-ethnic hub where White (35.5%), Hispanic (31.4%), and Black (28.3%) populations each hold substantial shares, creating a demographic profile more typical of a large urban center than a suburban village. With only 16.9% of adults holding a college degree, Spring Valley is a working-class community where immigrant entrepreneurship and established family networks coexist, giving the city a distinctive, fast-paced character that sets it apart from the quieter, wealthier towns of Rockland County.
How the city was settled and grew
Spring Valley’s original population was drawn by the railroad and the quarry industry in the mid-19th century. The New York and Erie Railroad arrived in 1841, and the discovery of high-quality sandstone in the area sparked a quarrying boom that brought Irish and Italian laborers to the Monsey border area and the Hillcrest section. These workers built the stone foundations of New York City buildings and, in turn, built Spring Valley’s first dense neighborhoods of wood-frame houses along Main Street and Maple Avenue. By the early 1900s, Jewish families fleeing tenement life in Manhattan began arriving, establishing a strong Orthodox and Hasidic presence in the West Spring Valley area near the Monsey line. This wave continued through the 1950s, as suburbanization drew more Jewish families to the village, creating a tight-knit religious community that remains influential today.
Modern era (post-1965)
The 1965 Hart-Cellar Act reshaped Spring Valley’s population dramatically. The first major post-1965 wave was African American families moving north from New York City and directly from the South, drawn by affordable housing and factory jobs at the nearby General Motors plant in Tarrytown and local manufacturing. They settled primarily in the East Spring Valley neighborhoods around East Church Street and the Memorial Park area, forming a stable Black middle class by the 1980s. Simultaneously, Hispanic immigration—initially Puerto Rican, then Dominican, and later Central American—accelerated through the 1990s and 2000s. These families concentrated in the Central Spring Valley corridor along Route 45 and South Main Street, where bodegas, Spanish-language churches, and small businesses now anchor daily life. The Indian subcontinent community (1.8% of the population) arrived later, primarily in the 2000s, settling in the North Spring Valley area near the New Hempstead border, often working in the region’s healthcare and hospitality sectors. East and Southeast Asian residents (1.1%) are a smaller, more dispersed group, with no single dominant neighborhood. The White population, once the overwhelming majority, has declined to 35.5%, with many older Jewish and Italian families moving to adjacent Monsey or out of state, though the Orthodox Jewish community remains concentrated in the western edge of the village.
The future
Spring Valley’s population is trending toward further diversification, but not toward homogenization. The Hispanic share is growing steadily, driven by both immigration and higher birth rates, and is projected to approach parity with the White population within a decade. The Black population has plateaued, with some out-migration to more affordable areas in Orange County and Pennsylvania. The Orthodox Jewish community, while shrinking as a share of the total, remains demographically distinct due to high birth rates and strong institutional ties. The Indian and East/Southeast Asian communities are small but growing slowly, attracted by the village’s relatively low housing costs compared to nearby Bergen County, New Jersey. The city is not tribalizing into hostile enclaves, but it is becoming a patchwork of distinct ethnic corridors—Hispanic Central Spring Valley, Black East Spring Valley, Orthodox Jewish West Spring Valley—each with its own commercial strip and civic life. The next 10-20 years will likely see the Hispanic share become the largest single group, while the White share continues a gradual decline. The foreign-born rate may rise slightly but is unlikely to exceed 30%, as housing density and school capacity limit further influx.
For someone moving in now, Spring Valley is becoming a denser, more Hispanic, and more working-class city—a place where ethnic identity remains strong and neighborhoods are defined by who lives there, not by a single melting-pot identity. It offers affordability and diversity, but also the challenges of a community where educational attainment is low and economic mobility is uneven. The city’s future is not one of assimilation into a suburban norm, but of continued ethnic pluralism, with each group maintaining its own institutions and geography.
* Values derived from national, state, county, city and local statistics and may differ in a specific area. Last updated: 2026-05-01T10:30:58.000Z
Narrative content on this page is AI-generated and may contain mistakes. Verify any details that matter before acting on them.
ReloMaps may earn a commission from affiliate links at no extra cost to you.