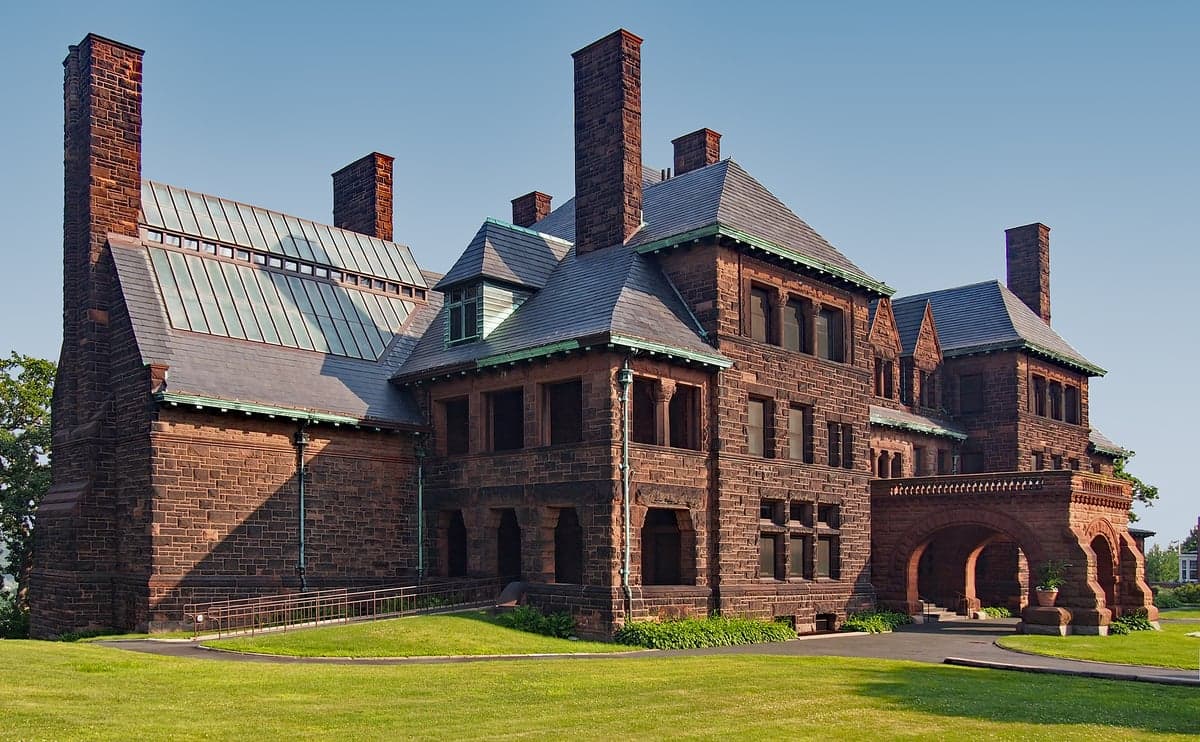
Photo: Wikipedia
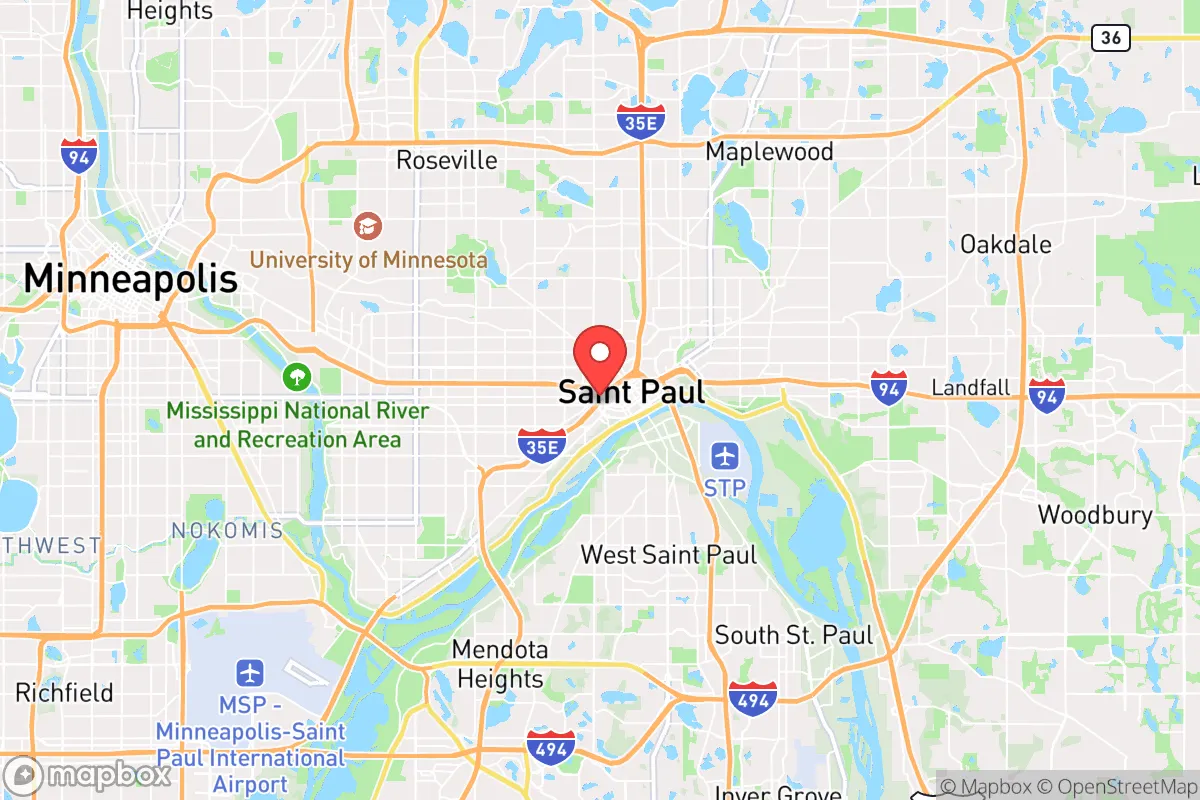
Demographics of St Paul, MN
Affluence Level in St Paul, MN
A middle-class area roughly in line with national averages across income, home values, education, and employment.
People of St Paul, MN
The people of St. Paul, Minnesota, today number 307,762, forming a city that is notably more diverse and working-class than its twin city Minneapolis, with a distinctive blend of established European-heritage neighborhoods and vibrant immigrant enclaves. The city’s identity is shaped by a white plurality (50.6%), a significant East/Southeast Asian community (17.0%), a Black population of 16.0%, and a Hispanic share of 9.1%, with a relatively low foreign-born rate of 6.8% suggesting deep-rooted, multigenerational communities rather than a transient gateway city. St. Paul is a place of stable, often insular neighborhoods where ethnic identity remains visible in church steeples, commercial corridors, and annual festivals, giving it a character that feels more like a collection of small towns than a single metropolis.
How the city was settled and grew
St. Paul’s population history begins with the Dakota people, who ceded the land in the 1837 Treaty with the United States, followed by the arrival of European-American fur traders and soldiers at Fort Snelling. The city’s explosive growth came after 1849, when it was named the territorial capital, drawing a wave of Yankee and New England settlers who established the city’s early commercial and political elite in the Summit Avenue and Cathedral Hill neighborhoods. The real demographic foundation, however, was laid by massive immigration from Germany and Ireland in the 1850s through the 1880s, with German Catholics clustering in the West Side flats and Irish laborers filling the Lowertown and Dayton’s Bluff areas near the riverfront rail yards. A second major wave brought Swedes and Norwegians in the 1870s-1890s, who settled the East Side neighborhoods like Phalen and Payne-Phalen, building Lutheran churches and cooperative institutions that remain community anchors. By 1900, St. Paul was a majority-German and Irish city, with a strong Scandinavian minority, and its population peaked at around 310,000 in the 1950s before suburbanization began.
Modern era (post-1965)
The 1965 Immigration and Nationality Act reshaped St. Paul’s demographics dramatically. The most transformative wave was the arrival of Hmong refugees from Laos beginning in the late 1970s, who settled heavily in the Thomas-Dale (Frogtown) and Payne-Phalen neighborhoods, creating the largest urban Hmong population in the United States. This East/Southeast Asian community now constitutes 17.0% of the city’s population, with Frogtown’s University Avenue corridor lined with Hmong-owned businesses and the annual Hmong New Year celebration drawing tens of thousands. A smaller but significant Mexican and Central American migration began in the 1980s, concentrated on the West Side (the “Lower West Side” or “District del Sol”), where Hispanic residents now make up roughly a third of the neighborhood’s population. The Black population (16.0%) grew primarily through domestic migration from the Great Lakes and Upper South, settling in the Rondo and Summit-University neighborhoods, though the historic Rondo community was largely destroyed by the construction of Interstate 94 in the 1960s. White flight to suburbs like Woodbury and Cottage Grove accelerated after 1970, but St. Paul’s white population has stabilized in recent decades, concentrated in the Macalester-Groveland and Highland Park areas, which remain among the most educated and affluent parts of the city.
The future
St. Paul’s population is slowly diversifying, but the pace is moderate compared to other Midwestern cities. The white share (50.6%) is declining gradually as older European-heritage residents age in place and younger white families choose suburbs or Minneapolis. The East/Southeast Asian community, primarily Hmong and Karen (Burmese), is growing through both refugee resettlement and natural increase, with the Hmong population now entering its third generation and showing signs of suburban dispersal to Maplewood and Oakdale. The Hispanic population (9.1%) is the fastest-growing segment, driven by both immigration and higher birth rates, and is expanding beyond the West Side into the East Side and Dayton’s Bluff. The Black population has plateaued, with little new domestic migration and some out-migration to southern suburbs. The city is not homogenizing; rather, it is tribalizing into distinct ethnic enclaves that remain remarkably stable—Frogtown stays Hmong, the West Side stays Hispanic, and Highland Park stays white and professional. The next 10-20 years will likely see the city become a majority-minority city, but one where each group maintains its own institutions and geography rather than blending into a single melting pot.
For someone moving to St. Paul now, the city offers a choice of distinct, identity-rich neighborhoods rather than a uniform urban experience. The practical reality is that where you live will largely determine your daily interactions, your children’s school demographics, and your sense of community. St. Paul is becoming a city of parallel communities—each with its own history, language, and institutions—rather than a place of rapid assimilation. This can be appealing for those seeking a stable, rooted neighborhood, but it also means that newcomers may find the city less integrated than its overall diversity numbers suggest.
* Values derived from national, state, county, city and local statistics and may differ in a specific area. Last updated: 2026-04-24T18:35:50.000Z
Narrative content on this page is AI-generated and may contain mistakes. Verify any details that matter before acting on them.
ReloMaps may earn a commission from affiliate links at no extra cost to you.