
Photo: Wikipedia
Quality of Life in Tigard, OR
Above-average quality of iife. The area offers a reasonable cost of living, decent mobility, and a mix of neighborhood amenities.
What does Quality of Life tell us?
Quality of Life blends cost of living, nearby amenities, socioeconomic signals, and neighborhood character. City-level scores represent the whole municipality; individual neighborhoods can differ.
What does this tell us?
Quality of Life blends cost of living, nearby amenities, socioeconomic signals, and neighborhood character. City-level scores represent the whole municipality; individual neighborhoods can differ.
Cost of Living
72% above national average
The Real Cost of Living in Tigard, OR for 2026
| Tier | Individual | Family (4) |
|---|---|---|
| Survival | $28k | $52k |
| Comfortable | $107k | $157k |
| Luxury | $156k+ | $242k+ |
| Elite (Top 5%) | $184k+ | $285k+ |
67%
The Area Signal
A metric tracking the socioeconomic signals of the area.
Hobbies
Explore the areaGroceries
10 within 10 miles
Gas
20 within 10 miles
Hospital
20 within 20 miles
Airport
PDX — Portland International
Post Office
USPS — Tigard, OR
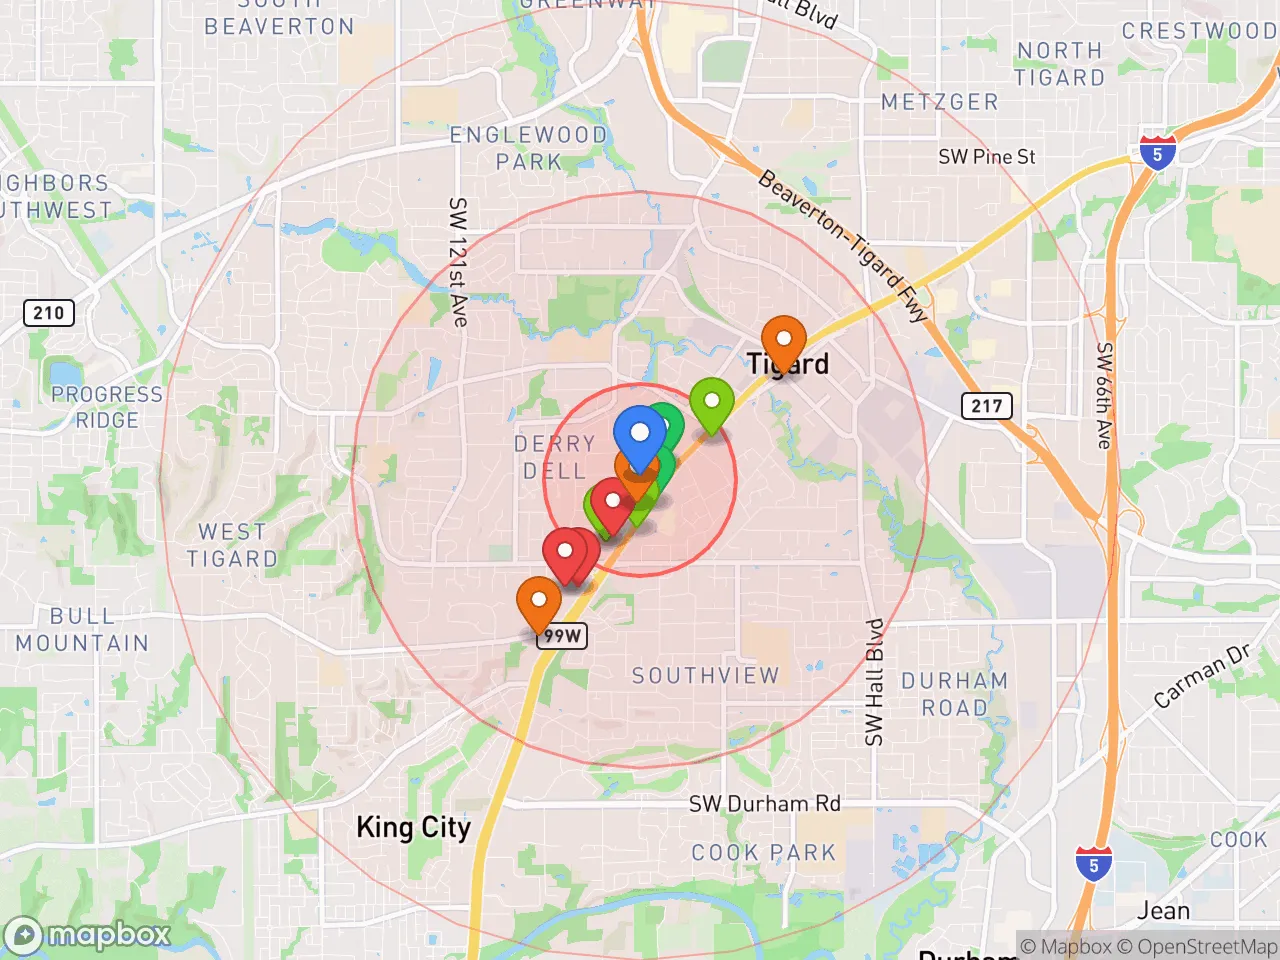
Critical Amenities
Quality-of-Life Analysis
Tigard, Oregon, presents a quality of life defined by suburban affluence and convenient access to Portland’s urban core, attracting a mix of established professionals, growing families, and long-term residents who value stability over rapid change. With a cost of living index of 172—well above the national average of 100—the city sits in a higher price bracket than many U.S. suburbs, yet it remains more affordable than neighboring Lake Oswego or downtown Portland. The typical resident is a homeowner in their 40s or 50s, often commuting to tech, healthcare, or finance jobs in the Portland metro, while a smaller cohort of renters includes younger workers drawn by Tigard’s relatively lower rents compared to the city’s western suburbs.
Cost of living and housing affordability compared to Portland and Lake Oswego
Tigard’s housing market is the primary driver of its elevated cost of living. The median home value sits at $585,700, roughly 15% below Lake Oswego’s median but about 10% above Portland’s citywide figure. For renters, the median monthly rent of $1,732 is notably lower than Lake Oswego’s $2,100+ average, making Tigard a practical compromise for those who want a quieter suburb without paying premium west-side prices. However, this affordability gap is narrowing: since 2020, home values in Tigard have risen by roughly 30%, outpacing Portland’s 20% increase, as remote workers and families priced out of closer-in neighborhoods push outward. Property taxes in Washington County hover around 1.1% of assessed value, slightly below Multnomah County’s rate, offering a modest annual savings for homeowners. For a household earning the area’s median income of roughly $85,000, the typical mortgage payment consumes about 28% of gross income—a manageable but tight ratio by national standards.
What daily life is like for families: schools, parks, and commute realities
Daily life in Tigard centers on its well-regarded public schools, extensive park system, and a commute that balances suburban calm with urban access. The Tigard-Tualatin School District serves most of the city, with Tigard High School earning an 8/10 rating on GreatSchools and several elementary schools scoring above state averages in reading and math proficiency. Families frequently use the 800-acre Tualatin River National Wildlife Refuge for weekend hiking, while the city’s 20+ parks—including the popular Cook Park with its splash pad and sports fields—anchor weekday afternoons. The average commute time of 23.4 minutes is shorter than Portland’s 27-minute average, largely because many residents work in tech hubs like Beaverton (home to Nike’s global headquarters) or in Washington County’s dense office parks. Traffic on Highway 99W and I-5 can add 10–15 minutes during peak hours, but the commute remains manageable compared to suburbs farther south like Wilsonville. Retail amenities are concentrated at Washington Square Mall and the Tigard Triangle, offering grocery, dining, and shopping within a 10-minute drive for most households.
Tigard is best suited for families and professionals who prioritize good schools, short commutes, and suburban amenities over urban nightlife or extreme affordability. The city’s high cost of living will strain single-income households or those earning below the metro median, but for dual-income couples in tech, healthcare, or professional services, the trade-off of higher housing costs for lower commute times and strong schools is a clear win. Retirees may find the pace too busy and the taxes too high, while young singles often prefer Portland’s denser neighborhoods. Ultimately, Tigard delivers a stable, family-oriented quality of life that rewards those who can afford its premium—and who value predictability over excitement.
Crime in Tigard, OR
Generally safer than 60% of comparable U.S. locations.
Violent CrimeViolent Crime Analysis
Property CrimeProperty Crime Analysis
Crime Analysis
Tigard, Oregon, reports a violent crime rate of 252.2 incidents per 100,000 residents and a property crime rate of 3,512.1 per 100,000. While the violent crime figure sits below the national average, the property crime rate is significantly elevated, reflecting challenges common in the Portland metropolitan area. The city’s proximity to a large, progressive urban center means that regional criminal justice policies—often prioritizing rehabilitation and reduced incarceration—can directly impact local safety by returning repeat offenders to the street more quickly.
Crime in context
Tigard’s violent crime rate of 252.2 per 100,000 is roughly 30% lower than the U.S. average of about 380 per 100,000, placing it in a relatively safer tier for personal safety among Portland suburbs. However, its property crime rate of 3,512.1 per 100,000 is nearly double the national average of roughly 1,950 per 100,000. This disparity is a hallmark of the broader Washington County and Portland metro area, where property offenses—particularly theft from vehicles, package theft, and catalytic converter theft—are persistent problems. Residents face a roughly 1-in-28 annual chance of experiencing property crime, compared to a 1-in-50 chance nationally.
What residents experience
For daily life in Tigard, the high property crime rate translates into practical concerns: leaving a car unlocked or a garage door open for even a short period carries real risk. Neighborhood social media groups frequently report thefts from parked cars, especially near shopping centers like Washington Square Mall and along Highway 99W. Violent crime is less common but not absent, with incidents concentrated in specific areas and often tied to domestic disputes or drug-related activity. The progressive orientation of Multnomah and Washington County district attorneys—who have implemented policies like presumptive citation for low-level theft and reduced prosecution of certain drug possession cases—means that many property offenders cycle through the system without serving significant time. This creates a perception among residents that the justice system prioritizes offender leniency over public safety, leading to frustration and a sense that reporting minor crimes yields little consequence for perpetrators.
Neighborhood-level variation is notable. Areas closer to the Tigard Triangle and along the MAX light rail corridor tend to see higher concentrations of property crime and occasional vagrancy-related incidents. In contrast, residential neighborhoods west of Highway 217, such as the Summerfield area and parts of Bull Mountain, report lower crime rates, though they are not immune to theft. Homeowners in these quieter pockets still face a property crime risk roughly 50% higher than the national average, driven largely by regional criminal justice policies that reduce the deterrent effect of arrest and prosecution. For those considering a move to Tigard, investing in security systems, motion-sensor lighting, and comprehensive renter’s or homeowner’s insurance is a practical necessity rather than an optional precaution.
* Values derived from national, state, county, city and local statistics and may differ in a specific area. Last updated: 2026-05-03T04:10:22.000Z
Narrative content on this page is AI-generated and may contain mistakes. Verify any details that matter before acting on them.
ReloMaps may earn a commission from affiliate links at no extra cost to you.