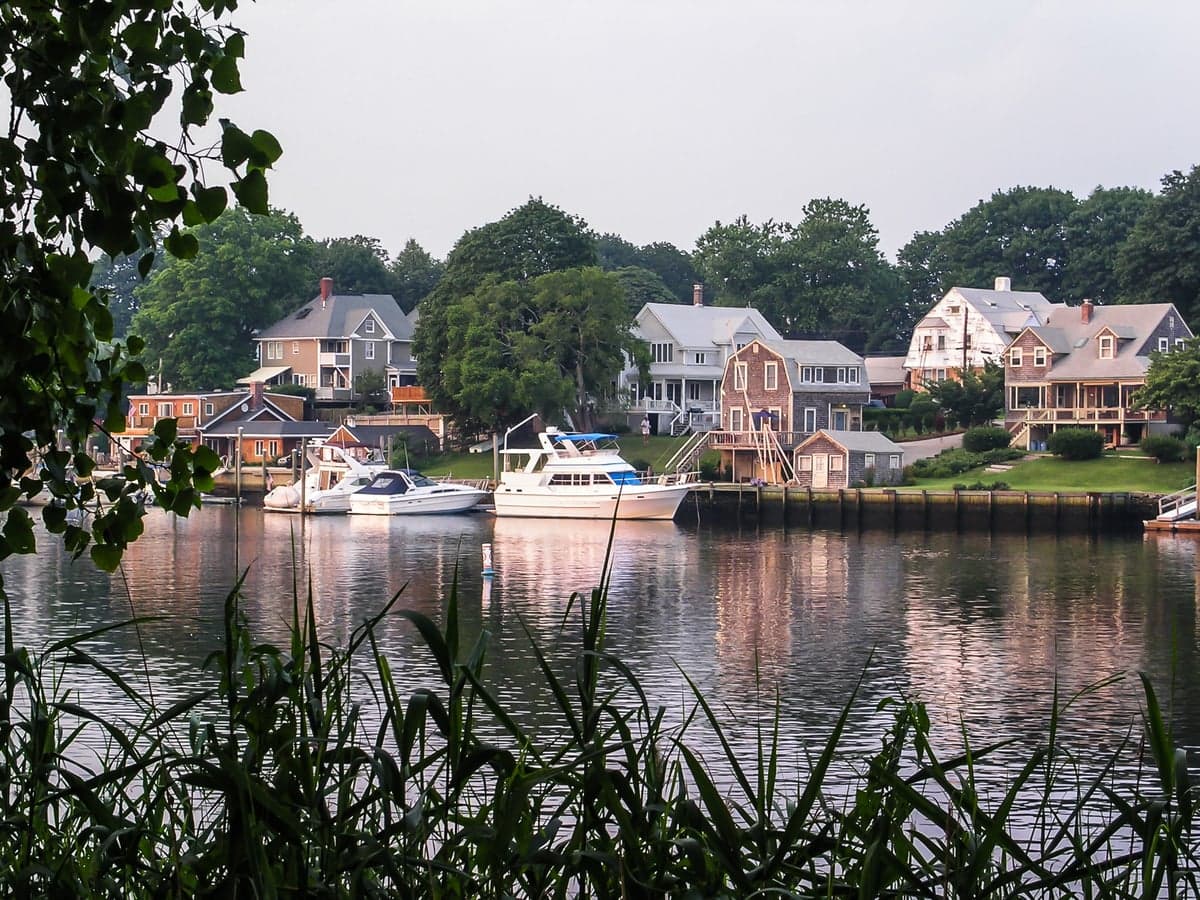
Photo: Wikipedia
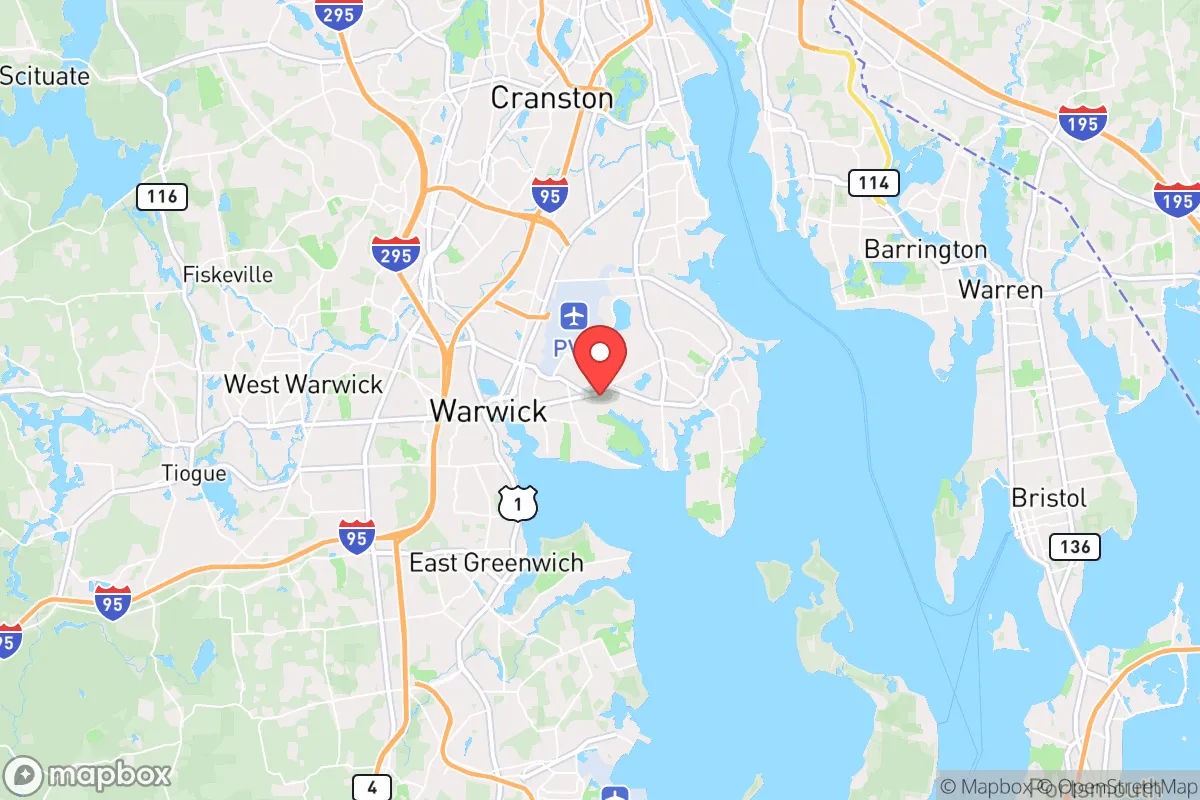
Demographics of Warwick, RI
Affluence Level in Warwick, RI
A middle-class area roughly in line with national averages across income, home values, education, and employment.
People of Warwick, RI
The people of Warwick, Rhode Island today form a predominantly white, middle-class population of 82,871 that is notably less diverse than the state as a whole, with 84.5% identifying as white alone. The city carries a distinctly suburban, family-oriented character, with 33.2% of adults holding a college degree and a foreign-born population of just 2.5% — roughly one-third the national average. Warwick’s identity is shaped by its deep Yankee and Franco-American roots, its role as a bedroom community for Providence and Boston, and a growing but still small Hispanic presence concentrated in specific neighborhoods. For a conservative-leaning audience, Warwick represents a stable, low-diversity city where traditional New England community structures remain intact, though gradual demographic shifts are underway.
How the city was settled and grew
Warwick was founded in 1642 by Samuel Gorton, a religious dissenter expelled from both Plymouth and Portsmouth, who established a settlement based on individual land grants rather than a centralized church. The original English settlers — farmers, tradesmen, and seafarers — built homesteads in what are now Apponaug (the historic village center) and Pawtuxet, a coastal village that became a hub for shipbuilding and maritime trade. Throughout the 18th and 19th centuries, the population grew slowly, anchored by agriculture and small-scale manufacturing along the Pawtuxet River. The major population wave came in the late 19th and early 20th centuries, when French-Canadian mill workers arrived to staff the textile mills in Pawtuxet Village and Conimicut, establishing strong Franco-American communities that remain visible today in local parishes and cultural organizations. Irish and Italian immigrants followed, settling in working-class neighborhoods near the mills and the port areas of Greenwich Bay. By 1950, Warwick’s population had swelled to over 43,000, driven by the post-war suburban boom and the expansion of T.F. Green Airport, which drew new residents seeking affordable housing within commuting distance of Providence.
Modern era (post-1965)
After the 1965 Hart-Cellar Act, Warwick’s foreign-born population remained remarkably low compared to national trends, reflecting the city’s limited industrial base and lack of established ethnic enclaves to attract new immigrants. The most significant demographic shift since the 1970s has been domestic: the construction of large suburban subdivisions in Hoxsie and Lakewood drew middle-class families from Providence and other Rhode Island cities, reinforcing the city’s white, owner-occupied character. Hispanic residents — now 5.9% of the population — began arriving in the 1990s and 2000s, primarily from Puerto Rico and the Dominican Republic, and have concentrated in the more affordable rental stock near Pawtuxet Village and along the Post Road corridor. The Black population (2.8%) and East/Southeast Asian population (1.4%) remain small and dispersed, with no single neighborhood reaching a critical mass. Indian-subcontinent residents (1.3%) are a recent addition, largely professionals drawn to jobs in healthcare and technology in the Providence metro area, and tend to settle in newer developments in Lakewood and the western side of the city. The overall picture is one of slow, modest diversification rather than rapid change — Warwick remains a city where the vast majority of residents are native-born whites, and where immigrant communities are too small to form distinct ethnic enclaves.
The future
Warwick’s population is projected to remain stable or decline slightly over the next decade, as the city is built out with little undeveloped land and an aging housing stock. The Hispanic share is likely to continue growing gradually, driven by natural increase and continued migration from Puerto Rico and Latin America, but will likely remain below 10% for the foreseeable future. The East/Southeast Asian and Indian-subcontinent populations are expected to grow modestly as professionals seek affordable alternatives to Boston and Providence, but Warwick lacks the high-tech job base or ethnic infrastructure to attract large numbers. The white population, while still dominant, will continue to age — Warwick has a median age of 44, well above the national average — which may lead to increased turnover of single-family homes as older residents downsize or move to warmer climates. The city is not tribalizing into distinct enclaves; rather, it is slowly homogenizing into a more diverse but still overwhelmingly white, middle-class suburb. For a conservative-leaning individual or family moving in now, Warwick offers a stable, low-crime environment with strong schools and community institutions, where demographic change is gradual enough to avoid the social friction seen in faster-changing cities.
Warwick is becoming a slightly more diverse, steadily aging suburb that retains its core Yankee and Franco-American character while absorbing small, dispersed immigrant populations. For someone moving in today, the city represents a predictable, family-oriented community where the pace of change is slow and the dominant culture remains intact — a place where traditional New England values of self-reliance, civic engagement, and neighborly familiarity still hold sway.
* Values derived from national, state, county, city and local statistics and may differ in a specific area. Last updated: 2026-04-22T22:51:39.000Z
Narrative content on this page is AI-generated and may contain mistakes. Verify any details that matter before acting on them.
ReloMaps may earn a commission from affiliate links at no extra cost to you.