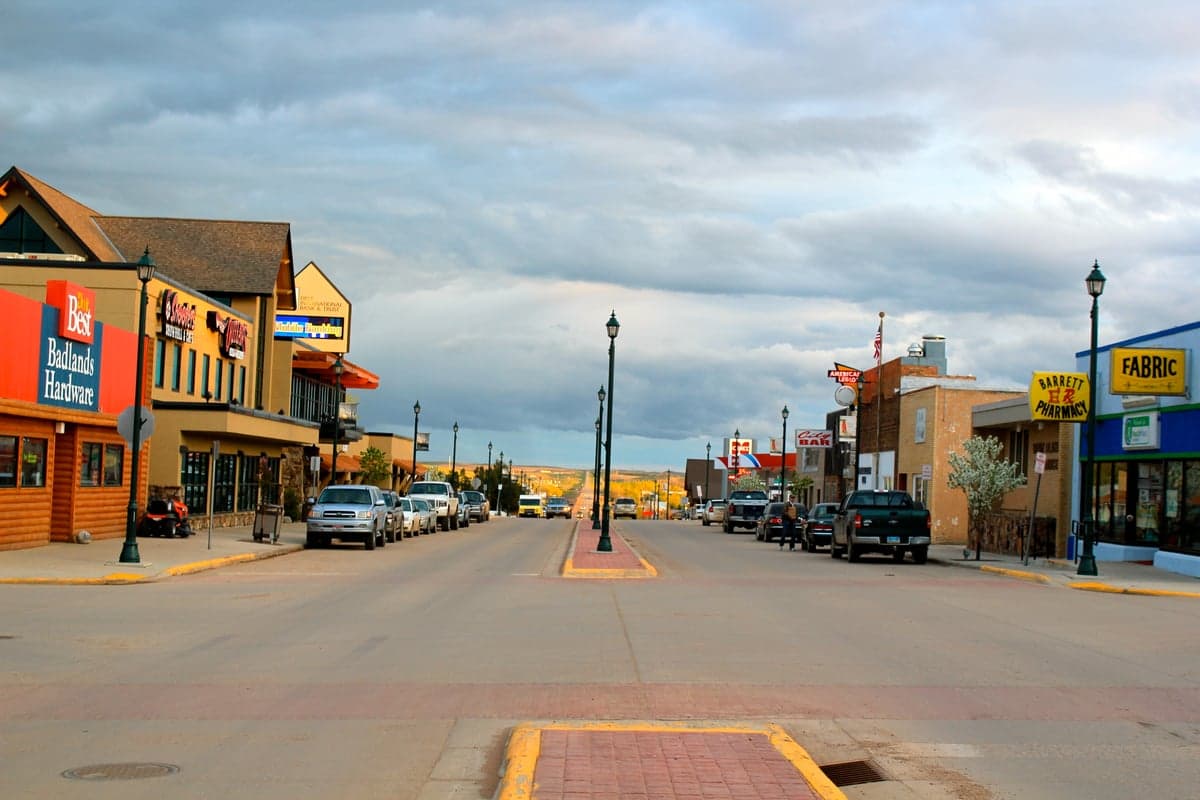
Photo: Wikipedia
Quality of Life in Watford City, ND
A livable area that tracks near national norms for affordability, walkability, and neighborhood health.
What does Quality of Life tell us?
Quality of Life blends cost of living, nearby amenities, socioeconomic signals, and neighborhood character. City-level scores represent the whole municipality; individual neighborhoods can differ.
What does this tell us?
Quality of Life blends cost of living, nearby amenities, socioeconomic signals, and neighborhood character. City-level scores represent the whole municipality; individual neighborhoods can differ.
Cost of Living
17% above national average
The Real Cost of Living in Watford City, ND for 2026
| Tier | Individual | Family (4) |
|---|---|---|
| Survival | $19k | $36k |
| Comfortable | $75k | $110k |
| Luxury | $160k+ | $247k+ |
| Elite (Top 5%) | $212k+ | $329k+ |
80%
Hobbies
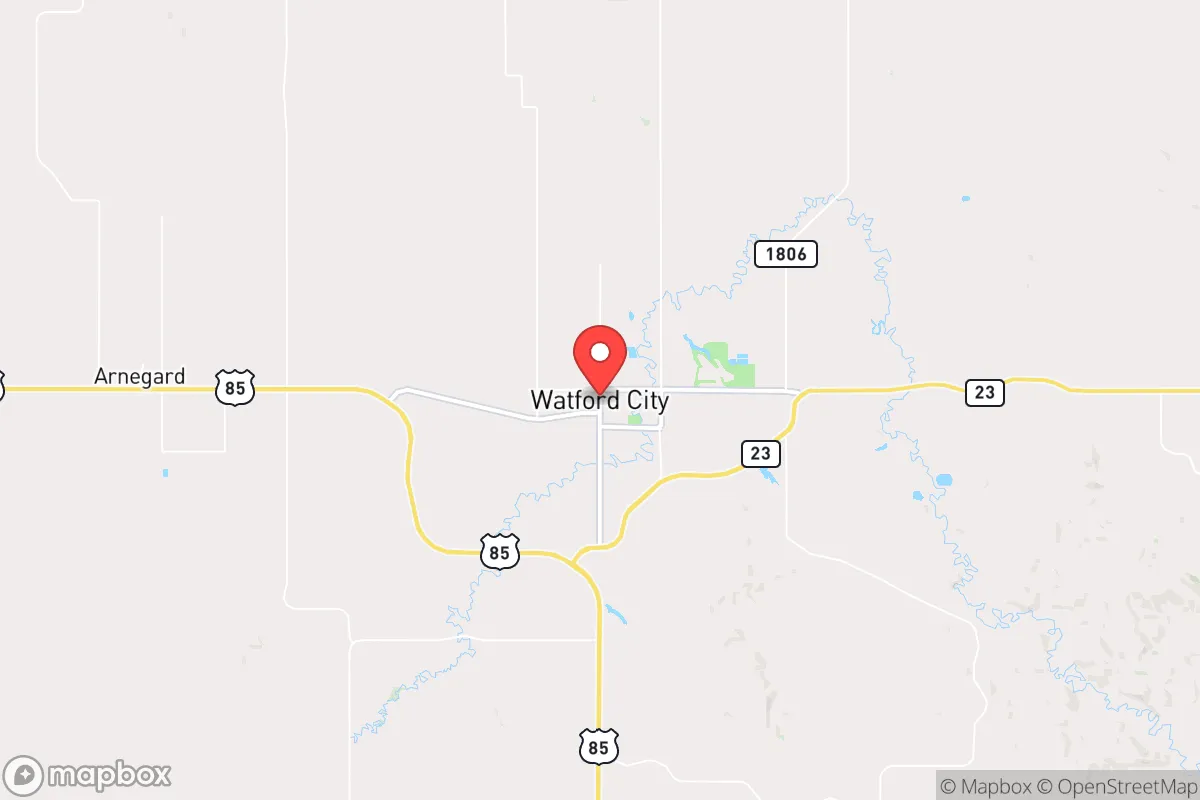
Explore the areaGroceries
0 within 10 miles
Gas
0 within 10 miles
Hospital
0 within 20 miles
Airport
Watford City Municipal Airport
Post Office
Critical Amenities
Quality-of-Life Analysis
Watford City, North Dakota, presents a distinctive quality-of-life profile shaped by the Bakken oil boom, resulting in a population that is notably younger, more transient, and more affluent than the national average. The city’s economy is dominated by energy-sector jobs, drawing a workforce of rig operators, engineers, and support staff who earn high wages but face a cost of living that is 17% above the U.S. baseline. This creates a community where financial opportunity is high, but the trade-offs include a tight housing market and a fast-paced, work-oriented daily rhythm.
Cost of living and housing affordability compared to Williston and Dickinson
With a composite cost of living index of 117, Watford City is significantly more expensive than the national average, though it remains slightly cheaper than its larger oil-patch neighbor Williston (index ~120). The primary driver of this elevated cost is housing. The median home value in Watford City is $385,100, a figure that has cooled from peak boom years but still places homeownership out of reach for many service-sector workers. For renters, the median rent of $1,210 is roughly 30% higher than the national median, though it is notably lower than in Williston, where comparable units often exceed $1,400. One relative bright spot is the average commute time of just 19.3 minutes, which is well below the national average of 26 minutes, reflecting the city’s compact layout and the concentration of jobs within McKenzie County. However, affordability is a two-tier story: while energy-sector salaries can easily cover these costs, retail and hospitality workers often need roommates or longer commutes from more affordable outlying areas like Arnegard.
Schools, amenities, and what daily life is like for families
Daily life in Watford City is heavily influenced by the boom-and-bust cycle of the oil industry. The McKenzie County School District has invested heavily in new facilities, including the Watford City High School (opened 2019), which features modern science labs and a career-tech program aligned with local energy and trades jobs. However, class sizes have fluctuated with population swings, and teacher retention remains a challenge due to high housing costs. For recreation, the city offers the Rough Rider Center, a $42 million complex with an indoor aquatic center, ice rink, and event space, which serves as a social hub. Dining and retail options have expanded significantly since 2010, with national chains like McDonald’s and Subway joined by local spots such as The Little Missouri Grille. Still, the city lacks the cultural amenities of a larger metro—there is no movie theater or major shopping mall—so residents often drive 90 minutes to Dickinson or 2 hours to Bismarck for concerts, specialty shopping, or medical specialists. The rhythm of life is work-centric, with many residents on 14-day-on, 7-day-off rotations, creating a transient social scene where community ties can be harder to form than in a typical small town.
Watford City is best suited for individuals and families who are directly employed in or supported by the energy sector, particularly those who value high income potential and are comfortable with a frontier-like, boomtown atmosphere. Young professionals and skilled tradespeople will find ample job opportunities and competitive wages that offset the high cost of housing. Retirees or those seeking a quiet, low-cost rural lifestyle may struggle with the elevated prices and the constant churn of transient workers. Families with school-age children will benefit from the new school infrastructure but should be prepared for a community where extracurriculars and social networks can be disrupted by frequent relocations. Ultimately, Watford City offers a unique trade-off: financial upside and modern amenities in a remote setting, but with the instability and higher costs that come with an energy-driven economy.
Crime in Watford City, ND
Generally safer than 74% of comparable U.S. locations.
Violent CrimeViolent Crime Analysis
Property CrimeProperty Crime Analysis
Crime Analysis
Watford City, North Dakota, reports a violent crime rate of 387 incidents per 100,000 residents and a property crime rate of 1,951.3 per 100,000, placing it above national averages for both categories. These figures reflect the challenges of a rapidly growing oil-boom community, where transient populations and economic pressures can strain local law enforcement resources. While not a high-crime city by national urban standards, Watford City’s rates warrant careful consideration for potential residents.
Crime in context
Watford City’s violent crime rate of 387 per 100,000 is approximately 10% higher than the national average of roughly 350 per 100,000 and significantly exceeds North Dakota’s state average of about 280 per 100,000. Property crime in Watford City, at 1,951.3 per 100,000, is roughly 20% above the national average of 1,600 per 100,000 and nearly double the North Dakota state average of around 1,100 per 100,000. These elevated rates are typical of communities experiencing rapid population influx and economic volatility, as seen in other energy-sector boomtowns. The city’s location in McKenzie County, which has a conservative-leaning judicial system, means that local prosecutors generally take a tougher stance on crime compared to jurisdictions with progressive district attorneys, potentially leading to higher incarceration rates and fewer plea deals for violent offenders.
What residents experience
Residents commonly report that property crimes—particularly theft from vehicles, burglary of unoccupied homes, and theft of construction equipment—are the most frequent public safety issues. The transient workforce associated with the oil industry contributes to a higher incidence of these crimes, as does the prevalence of unsecured rental properties and work sites. Violent crime, while less common, includes aggravated assault and robbery, often linked to alcohol-fueled disputes in bars or temporary housing camps. Local law enforcement, including the Watford City Police Department and the McKenzie County Sheriff’s Office, maintain a visible presence and have adopted community policing strategies to build trust. However, the rapid population growth has at times outpaced the expansion of the police force, leading to longer response times in outlying areas.
Neighborhood-level variation in Watford City is notable. The newer subdivisions and single-family home areas west of Highway 85 tend to experience lower crime rates, while older downtown blocks and areas near temporary worker housing (such as man camps and RV parks) see higher concentrations of property crime and disorderly conduct. Areas immediately adjacent to the main commercial corridor along 2nd Avenue Southwest report the highest incident density, particularly for theft and vandalism. For families, the safest residential zones are the established neighborhoods east of the Little Missouri River, where community watch programs are active and home values have stabilized. Prospective renters should verify specific property crime data for any address, as block-by-block variation can be significant in this dynamic community.
* Values derived from national, state, county, city and local statistics and may differ in a specific area. Last updated: 2026-04-19T05:26:52.000Z
Narrative content on this page is AI-generated and may contain mistakes. Verify any details that matter before acting on them.
ReloMaps may earn a commission from affiliate links at no extra cost to you.