Photo: Wikipedia
Demographics of Weatherford, TX
Affluence Level in Weatherford, TX
A middle-class area roughly in line with national averages across income, home values, education, and employment.
People of Weatherford, TX
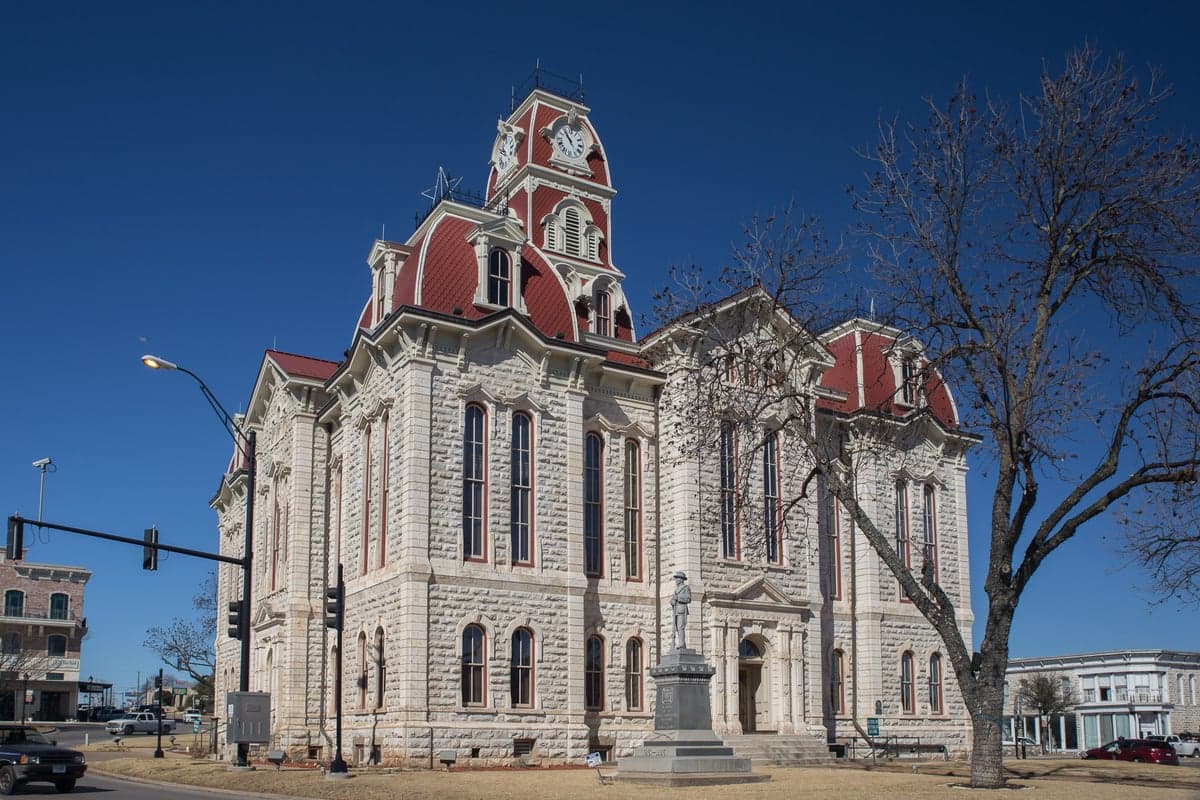
The people of Weatherford, Texas, today number 33,924, forming a community that is predominantly White (78.4%) with a growing Hispanic minority (13.5%) and small Black (2.8%) and East/Southeast Asian (1.7%) populations. The city retains a distinctly Western, ranching-oriented character, reflected in its annual Parker County Sheriff's Posse rodeo and the historic downtown square anchored by the 1886 courthouse. With a foreign-born share of just 3.7% and a college-educated rate of 28.6%, Weatherford's population is less diverse and less highly educated than the Dallas-Fort Worth metroplex average, but it has absorbed steady domestic in-migration from both rural Texas and suburban sprawl.
How the city was settled and grew
Weatherford's original population arrived in the 1850s as Anglo-American settlers from the Upper South and Midwest, drawn by the promise of cheap land through preemption claims and later railroad grants. The city was founded in 1856 as the seat of Parker County, named after a state senator, and its early economy revolved around cotton farming and cattle ranching. The first wave of settlers clustered around the courthouse square, building modest frame houses and brick storefronts that still define the Historic Downtown Weatherford district. By the 1880s, the Texas & Pacific Railroad connected Weatherford to Fort Worth, spurring a second wave of merchants, blacksmiths, and German immigrant farmers who settled in the South Main Street area, where many of their Victorian homes remain. A small African American community formed during Reconstruction, centered on the Booker T. Washington neighborhood near the former segregated school, though Black residents never exceeded 10% of the population. The city's population grew slowly but steadily, reaching about 6,000 by 1920, then stagnating through the Dust Bowl and World War II as younger residents left for urban jobs.
Modern era (post-1965)
The post-1965 period brought modest demographic change to Weatherford, driven primarily by domestic in-migration rather than foreign immigration. The 1970s and 1980s saw an influx of White families from the Dallas-Fort Worth metroplex seeking larger lots and lower taxes, fueling suburban-style subdivisions in Willow Park (an annexed area to the east) and the Holland Lake district west of downtown. Hispanic population growth began in the 1990s, as Mexican-American families moved from Fort Worth's North Side for construction and service jobs; they concentrated in the West Weatherford area around the Parker County Hospital District, where a small but stable Hispanic enclave now exists. The East/Southeast Asian community, at 1.7%, is a recent arrival—mostly Vietnamese and Filipino professionals employed at the Weatherford Regional Medical Center or commuting to Lockheed Martin in Fort Worth—and has no single ethnic neighborhood, instead dispersing across newer subdivisions like Thousand Oaks. The Black population, at 2.8%, remains concentrated in the historic Booker T. Washington neighborhood, though younger Black families have begun moving into the Annetta area to the south. The Indian subcontinent population is effectively zero, reflecting the city's lack of tech-sector employment that draws Indian professionals to other DFW suburbs.
The future
Weatherford's population is heading toward gradual diversification, but the pace will remain slow compared to the broader metroplex. The Hispanic share is projected to rise from 13.5% to perhaps 18-20% by 2040, driven by natural increase and continued migration from Fort Worth, with the West Weatherford area likely becoming a more defined Hispanic corridor. The White share will decline proportionally but remain above 70%, as domestic in-migration from rural counties offsets some outmigration of younger Whites to Dallas. The East/Southeast Asian and Black populations will grow incrementally, likely reaching 3-4% each, but will not form distinct ethnic enclaves—they will continue to disperse across newer subdivisions. The city is not tribalizing into sharply divided enclaves; rather, it is experiencing a mild homogenization of its historic neighborhoods as older Anglo residents age out and are replaced by younger, slightly more diverse families. The foreign-born share will remain low (under 6%) because Weatherford lacks the industrial or tech base that attracts large immigrant flows.
For someone moving in now, Weatherford is becoming a moderately diversifying exurb—still overwhelmingly White and culturally conservative, but with a growing Hispanic presence and small Asian and Black communities that are integrated rather than segregated. The city offers a slower pace of change than suburban Fort Worth, with a population that values its ranching heritage and low taxes, but it is not immune to the demographic currents reshaping the region. New residents should expect a community where the historic downtown remains the social anchor, where newcomers are welcomed but expected to assimilate into existing norms, and where the next decade will bring more Hispanic neighbors but little other ethnic change.
* Values derived from national, state, county, city and local statistics and may differ in a specific area. Last updated: 2026-04-15T19:40:14.000Z
Narrative content on this page is AI-generated and may contain mistakes. Verify any details that matter before acting on them.
ReloMaps may earn a commission from affiliate links at no extra cost to you.