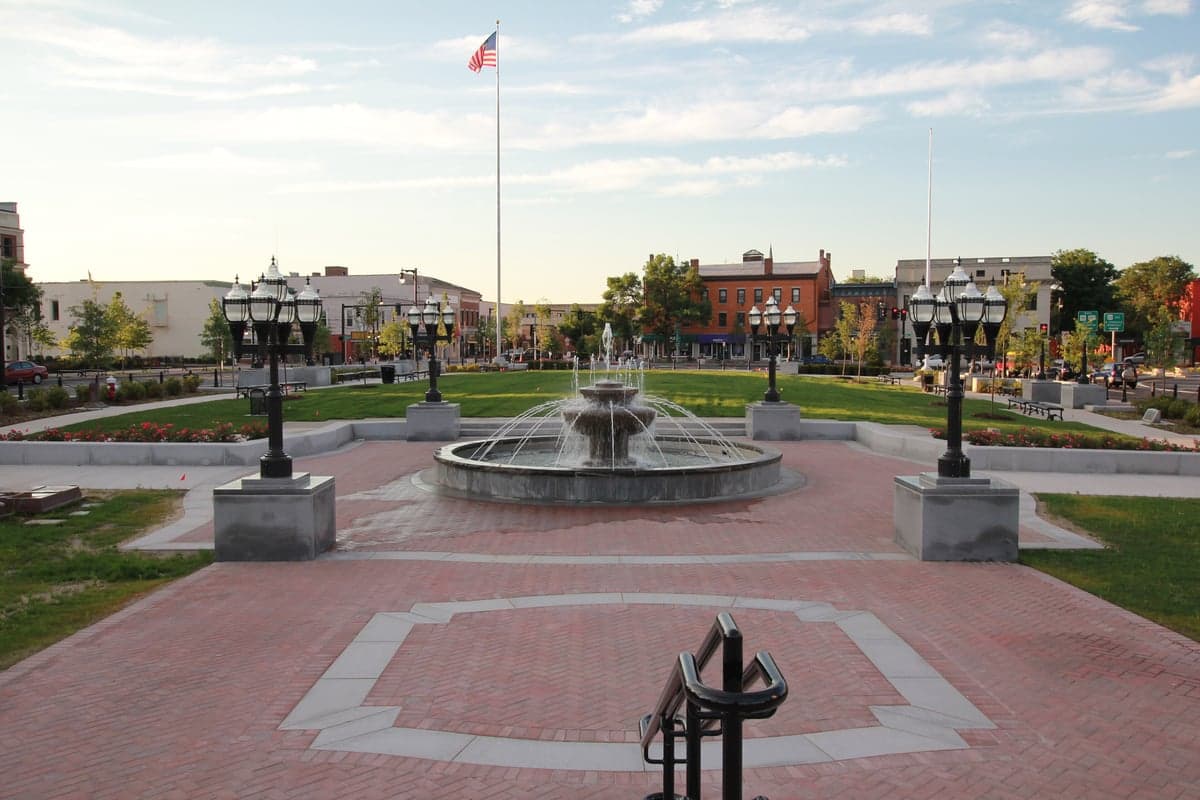
Photo: Wikipedia
Quality of Life in Westfield, MA
Above-average quality of iife. The area offers a reasonable cost of living, decent mobility, and a mix of neighborhood amenities.
What does Quality of Life tell us?
Quality of Life blends cost of living, nearby amenities, socioeconomic signals, and neighborhood character. City-level scores represent the whole municipality; individual neighborhoods can differ.
What does this tell us?
Quality of Life blends cost of living, nearby amenities, socioeconomic signals, and neighborhood character. City-level scores represent the whole municipality; individual neighborhoods can differ.
Cost of Living
3% below national average
The Real Cost of Living in Westfield, MA for 2026
| Tier | Individual | Family (4) |
|---|---|---|
| Survival | $17k | $32k |
| Comfortable | $57k | $84k |
| Luxury | $134k+ | $207k+ |
| Elite (Top 5%) | $157k+ | $244k+ |
98%
The Area Signal
A metric tracking the socioeconomic signals of the area.
Hobbies
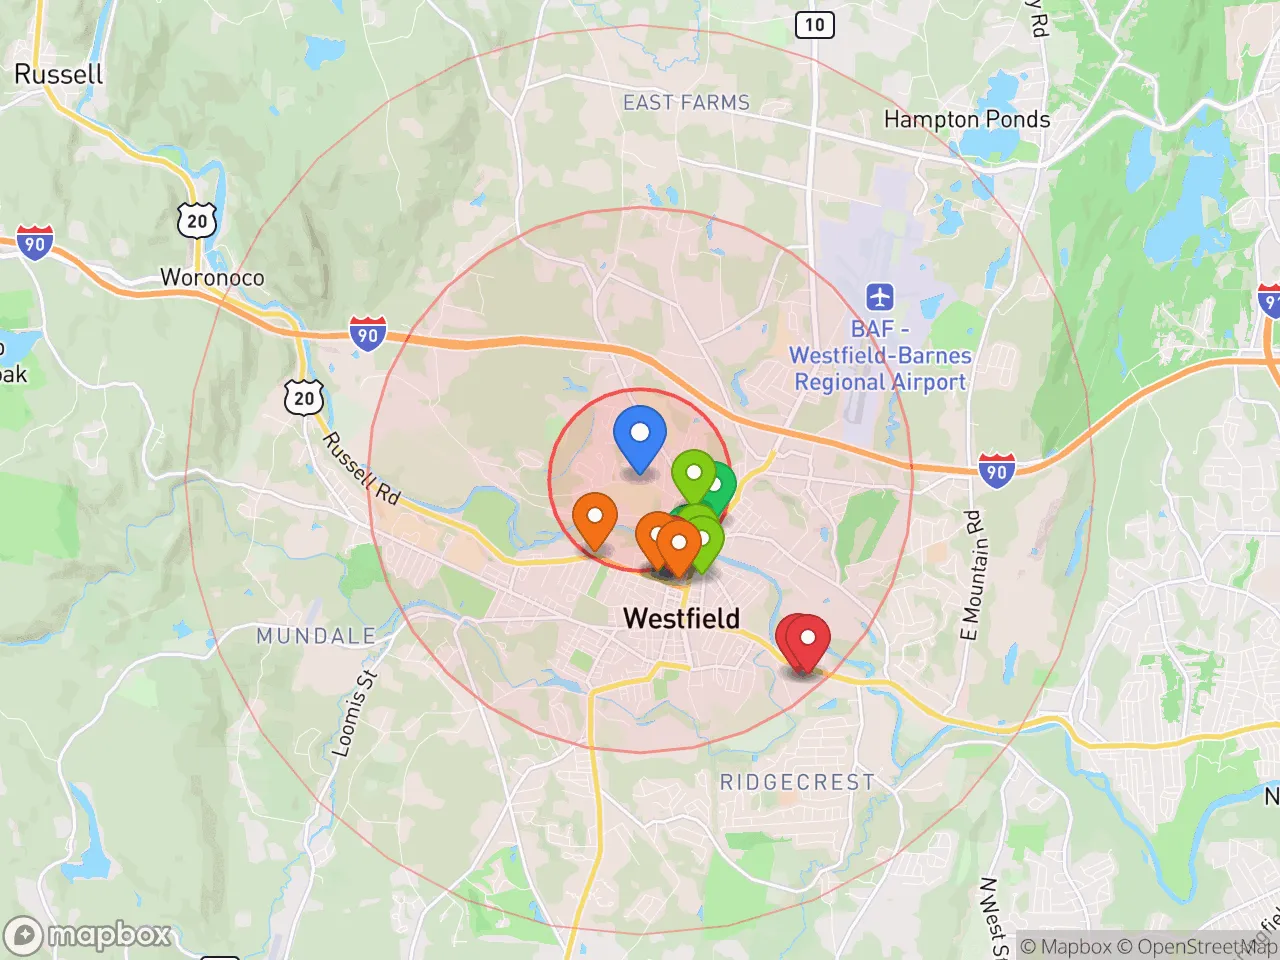
Explore the areaGroceries
7 within 10 miles
Gas
20 within 10 miles
Hospital
14 within 20 miles
Airport
JFK — John F. Kennedy International
Post Office
USPS — Westfield, MA
Critical Amenities
Quality-of-Life Analysis
Westfield, Massachusetts, offers a quality of life defined by solid middle-class stability, with a cost of living slightly below the national average and a demographic profile that leans heavily toward families and long-term residents. The city’s population of roughly 41,000 is notably more affordable than nearby Springfield or the Boston exurbs, attracting people who want suburban space and good schools without the premium price tag of the state’s eastern corridor. Median household income hovers around $67,000, and the community skews older and more settled than the national average, with a median age of 40.5 years.
How Westfield’s cost of living and housing compare to Springfield and the Pioneer Valley
Westfield’s overall cost-of-living index is 97, meaning everyday expenses run about 3% below the U.S. baseline. Housing is the biggest driver of that affordability: the median home value sits at $295,500, roughly $30,000 less than the Massachusetts median and about $50,000 below the average for Hampden County’s more expensive towns like Longmeadow. Renters also get a relative bargain, with a median rent of $1,064 — nearly $200 less than the state median and well under the $1,400+ typical in the Boston metro. Compared to Springfield (index 89), Westfield is slightly pricier, but it offers a lower crime rate and better-rated public schools, making the extra cost a trade-off many families accept. Property taxes in Westfield run about 1.5% of assessed value, which is moderate for Massachusetts. The average commute of 26.2 minutes is manageable, with most residents driving to jobs in Westfield itself, West Springfield, or Hartford, Connecticut — a 35-minute drive south on I-91.
What daily life is like for families: schools, parks, and local amenities
Westfield’s daily rhythm revolves around its strong public school system, which includes six elementary schools, two middle schools, and Westfield High School — all rated above average on GreatSchools, with the high school offering a robust Advanced Placement program. The city also hosts Westfield State University, a public liberal-arts college that brings a modest student population and cultural events to the area. For recreation, Stanley Park is the standout amenity: a 300-acre green space with gardens, a playground, a carousel, and a seasonal concert series. The downtown core along Elm Street has seen reinvestment, with local restaurants like Theodores’ BBQ and the Westfield Brewing Company drawing foot traffic, though the retail scene is smaller than in Holyoke or Springfield. Outdoor enthusiasts use the Columbia Greenway Rail Trail for biking and walking, and the nearby Westfield River offers fishing and kayaking. Healthcare access is solid, with Noble Hospital (part of Baystate Health) located within city limits, and major medical centers in Springfield 20 minutes away.
Westfield is best suited for families and professionals who want a quiet, affordable base with good schools and a manageable commute to Hartford or Springfield. Empty-nesters and retirees also find the city appealing due to its walkable downtown pockets, low crime relative to the region, and proximity to the Berkshires for weekend trips. Singles and young renters may find the social scene limited compared to Northampton or Amherst, but the lower rent and easy highway access make it a practical choice for those prioritizing savings over nightlife. Overall, Westfield delivers a stable, middle-class quality of life that rewards residents who value space, safety, and short commutes over urban energy.
Crime in Westfield, MA
Lower crime rates than 86% of comparable U.S. locations.
Violent CrimeViolent Crime Analysis
Property CrimeProperty Crime Analysis
Crime Analysis
Westfield, Massachusetts, reports a violent crime rate of 175.9 incidents per 100,000 residents and a property crime rate of 557.5 per 100,000, placing it below national averages but within a concerning regional context. As a small city situated near the larger Springfield metro area, Westfield’s safety profile is shaped by its proximity to urban crime centers and the broader criminal justice policies of Hampden County. While the city itself is not a high-crime hotspot, residents should be aware that progressive prosecutorial approaches in the region can influence local crime dynamics and recidivism rates.
Crime in context
Westfield’s violent crime rate is roughly half the national average of about 380 per 100,000, and its property crime rate is significantly below the U.S. figure of approximately 1,950 per 100,000. However, these numbers must be weighed against the realities of Hampden County, where district attorneys and judges have adopted increasingly progressive stances on sentencing and pretrial release. This ideological shift, while intended to reduce incarceration, has been linked to higher rates of repeat offending and property crime in surrounding communities. Westfield’s relatively low rates may offer a false sense of security, as criminals from nearby Springfield and Holyoke—where crime rates are substantially higher—can easily travel into the city. The property crime rate of 557.5 is notably higher than in many rural Western Massachusetts towns, reflecting the city’s role as a commuter suburb with accessible retail corridors.
What residents experience
Daily life in Westfield involves typical suburban concerns: package thefts, vehicle break-ins, and occasional vandalism, particularly near the downtown area and shopping plazas along Route 20. Violent crime is rare but not absent, with incidents concentrated in a few lower-income neighborhoods and near the Westfield River. Residents frequently report that police response times are adequate, but the Hampden County District Attorney’s office has a reputation for plea deals and reduced charges, which frustrates victims and emboldens property criminals. For families and retirees, the primary safety worry is not random violence but the cumulative effect of lenient justice—repeat offenders cycling through the system and returning to the same neighborhoods. The city’s own police department is proactive, but its efforts are undercut by county-level policies that prioritize diversion over detention.
Neighborhood-level variation is significant. The area around Stanley Park and the southern side of Westfield near the Southwick line are considered safer, with lower incident reports. In contrast, the central downtown corridor and streets near the Westfield Mall see more frequent property crimes. Proximity to the Westfield River and the Amtrak station also correlates with higher petty crime. For those considering relocation, the safest choice is a single-family home in the outer residential rings, away from commercial zones and major transit routes. Overall, Westfield offers a moderate safety profile for a small city near a large metro area, but the progressive justice environment in Hampden County is a legitimate concern for anyone prioritizing long-term security and accountability.
* Values derived from national, state, county, city and local statistics and may differ in a specific area. Last updated: 2026-05-01T11:37:58.000Z
Narrative content on this page is AI-generated and may contain mistakes. Verify any details that matter before acting on them.
ReloMaps may earn a commission from affiliate links at no extra cost to you.