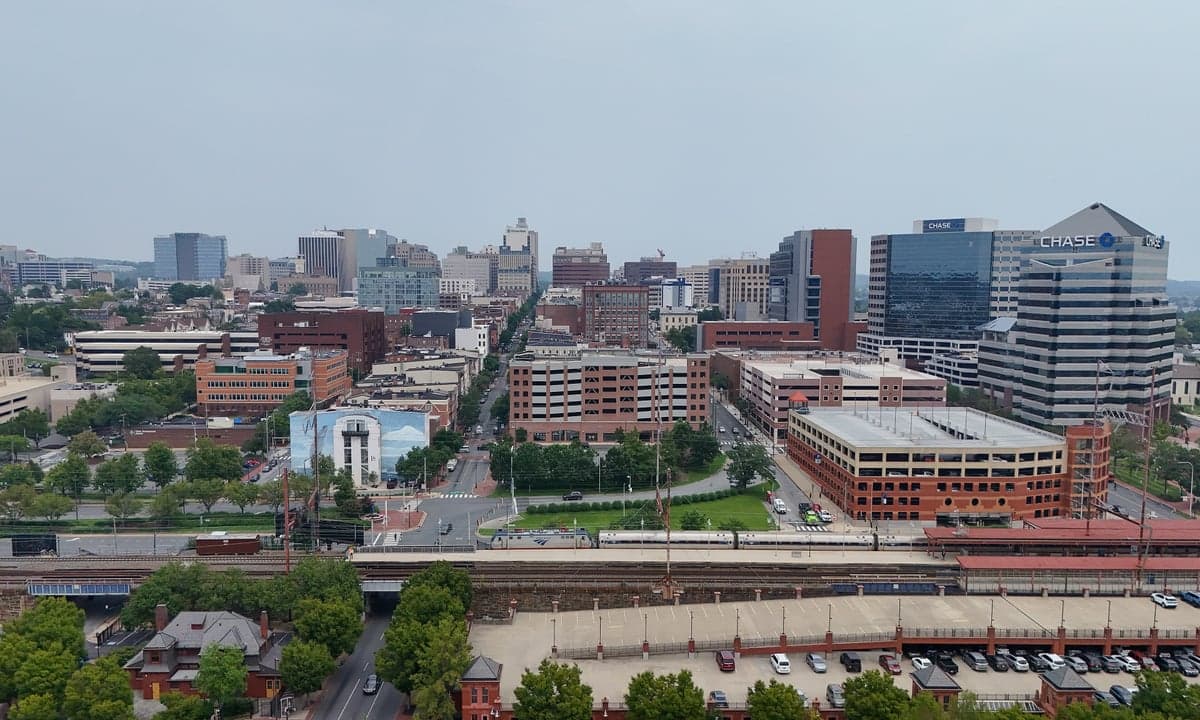
Photo: Wikipedia
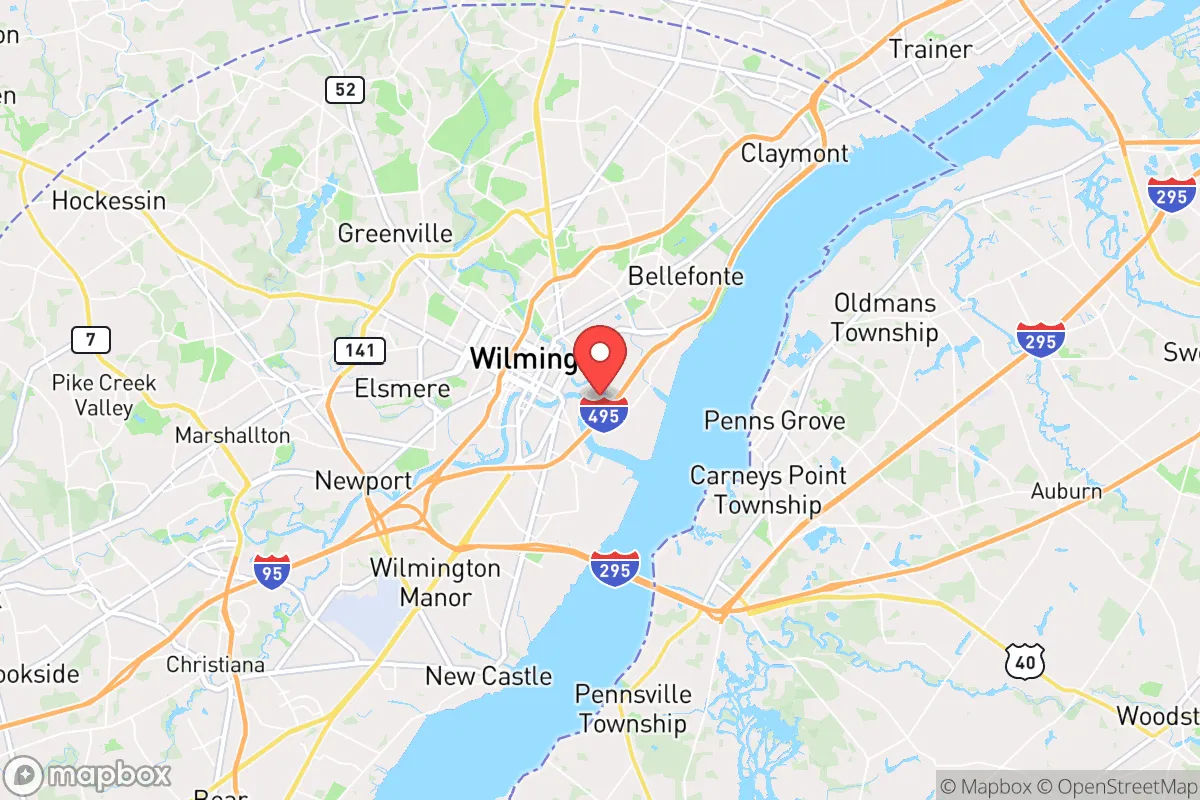
Demographics of Wilmington, DE
Affluence Level in Wilmington, DE
A below-average socioeconomic profile. Incomes, home values, and educational attainment trail the U.S., with higher poverty and unemployment.
People of Wilmington, DE
The people of Wilmington, DE today form a majority-Black city (51.6%) with a significant White minority (29.6%) and a growing Hispanic population (11.9%). With just 71,124 residents, it is a dense, compact urban center where foreign-born residents make up only 3.9% of the population—well below the national average. The city’s identity is shaped by its history as a manufacturing and chemical hub, its role as a destination for African American migration, and its current reality as a place where college-educated residents (33.1%) are a notable but not dominant share. Wilmington feels like a small city with big-city demographic challenges: a majority-minority population, modest immigration, and a population that has been slowly declining for decades.
How the city was settled and grew
Wilmington was founded in 1638 by Swedish settlers as part of the New Sweden colony, making it one of the oldest European settlements on the East Coast. The original population was a mix of Swedes, Finns, and Dutch, who established farms and trading posts along the Christina River. The city’s real growth came in the 19th century, driven by the DuPont family’s gunpowder mills along the Brandywine Creek and the rise of shipbuilding, railroading, and leather tanning. Irish and German immigrants arrived in large numbers between 1840 and 1880, settling in working-class neighborhoods like Little Italy (centered around Union Street) and the East Side, where they built row houses and Catholic parishes. By 1900, Wilmington was a thriving industrial city of over 76,000, with a largely White, European-born workforce.
The Great Migration (1910–1970) transformed Wilmington’s population. African Americans from the rural South—especially Virginia, Maryland, and the Carolinas—moved north for jobs in the city’s shipyards, chemical plants, and auto assembly lines. They concentrated in the Riverside and Southbridge neighborhoods, creating a vibrant Black business district along Market Street. By 1950, Black residents made up about 15% of the population, a share that would rise sharply in the following decades as White families began leaving for the suburbs.
Modern era (post-1965)
The 1968 riots following Martin Luther King Jr.’s assassination accelerated White flight from Wilmington. The city’s population peaked at 112,504 in 1940 and then fell steadily, dropping to 71,124 by 2020. The post-1965 era saw the Black population become the majority, rising from 44% in 1970 to over 55% by 1990. Today, Black residents make up 51.6% of the population, concentrated in the East Side, Riverside, and Southbridge—neighborhoods that have experienced disinvestment and high poverty rates. The White population, now 29.6%, is largely clustered in the Highlands (around the DuPont mansions) and the Trolley Square area, a historic streetcar suburb that has seen some gentrification. The Hispanic population grew from 2% in 1990 to 11.9% today, driven by Puerto Rican and Central American immigration, with a visible presence in the Baynard Village and Union Park Gardens neighborhoods. East/Southeast Asian residents (0.8%) and Indian-subcontinent residents (0.8%) are small but stable communities, many connected to the University of Delaware and the chemical industry.
The future
Wilmington’s population is projected to remain flat or decline slightly over the next decade, as it has since 1950. The city is not homogenizing—neighborhoods remain sharply divided by race and income. The Black population is slowly shrinking (down from 58% in 2010), while the Hispanic share is rising steadily, likely reaching 15–18% by 2035. The White population is stabilizing in a few gentrifying pockets like Trolley Square and the Riverfront, where new apartment construction has attracted young professionals. Foreign-born residents remain a small share (3.9%), and immigration is unlikely to drive growth. The biggest demographic story is the aging of the Black population and the out-migration of younger families to suburban New Castle County. For a conservative-leaning mover, Wilmington offers a dense urban environment with a strong sense of history, but the population trends suggest a city that is slowly becoming more Hispanic and more bifurcated by income, with limited growth overall.
Wilmington is becoming a smaller, more Hispanic, and more economically polarized city. For someone moving in now, the key question is which neighborhood they choose: the historic, walkable Trolley Square for a gentrifying urban experience, the Riverfront for new development, or the Highlands for established stability. The city’s population future is not one of boom, but of slow, managed change—and the opportunities are concentrated in specific enclaves rather than across the whole city.
* Values derived from national, state, county, city and local statistics and may differ in a specific area. Last updated: 2026-04-29T17:53:39.000Z
Narrative content on this page is AI-generated and may contain mistakes. Verify any details that matter before acting on them.
ReloMaps may earn a commission from affiliate links at no extra cost to you.