
Photo: Wikipedia
Demographics of Woodward, OK
Affluence Level in Woodward, OK
A middle-class area roughly in line with national averages across income, home values, education, and employment.
People of Woodward, OK
The people of Woodward, Oklahoma today form a predominantly white, working- and middle-class community of roughly 12,000, with a notable and growing Hispanic minority that now accounts for over 17% of the population. The city’s identity is rooted in its role as a regional trade and energy hub for the Oklahoma Panhandle, with a population density of about 1,100 people per square mile. Distinctive markers include a strong rodeo and agricultural heritage, a relatively low college attainment rate of 21.3%, and a foreign-born share of just 3.6%—indicating that most growth comes from domestic migration rather than international immigration.
How the city was settled and grew
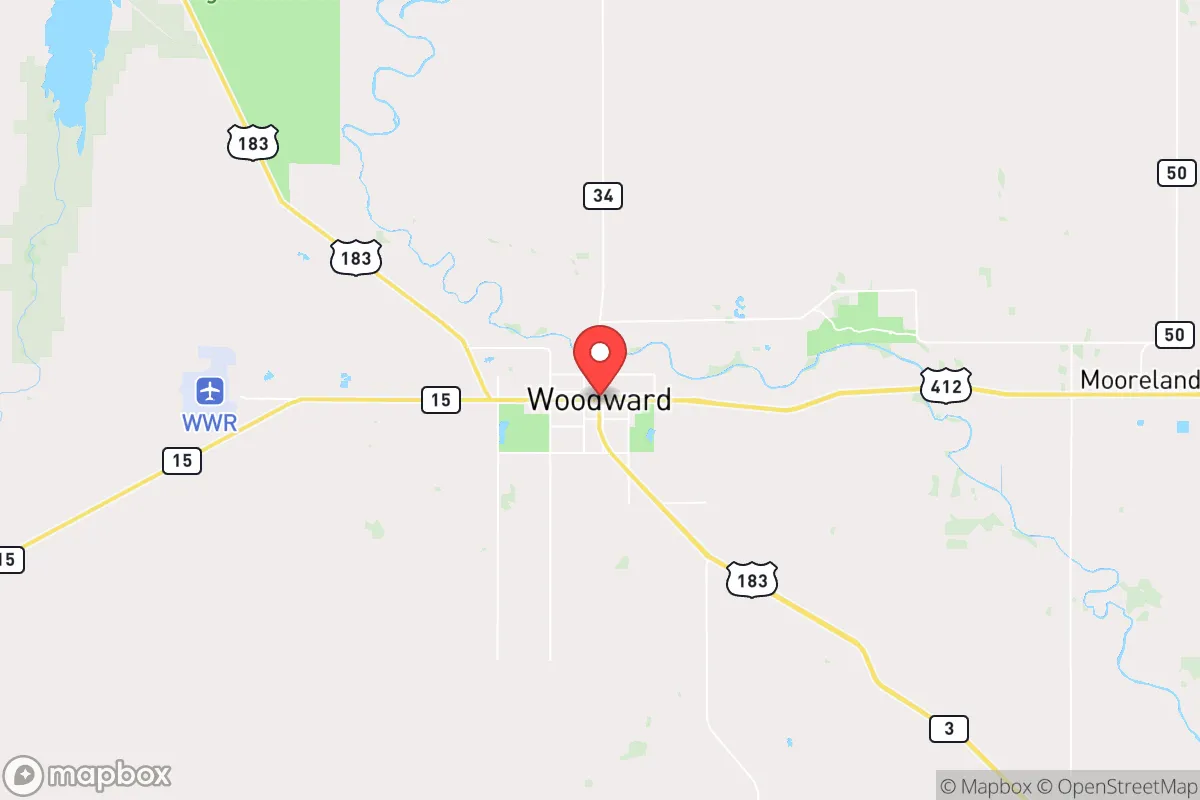
Woodward was founded in 1887 as a stop on the Southern Kansas Railway (later the Atchison, Topeka and Santa Fe), drawing its first wave of settlers from the land runs of the Unassigned Lands and the Cherokee Outlet opening of 1893. The original population was overwhelmingly white, composed of homesteaders, ranchers, and merchants from the Midwest and Upper South. The historic Downtown Woodward district, centered on Main Street and Oklahoma Avenue, was built by these early settlers and remains the city’s commercial core. A second wave arrived during the 1920s oil boom, when the discovery of the Oklahoma City Oil Field and later the Panhandle gas fields brought roughnecks and speculators. This boom created the North Woodward neighborhood, where modest worker cottages and boarding houses sprang up near the rail yards and oil storage tanks. By 1930, the population had reached roughly 5,000, and the city’s character as a conservative, resource-dependent community was firmly set.
Modern era (post-1965)
After the 1965 Hart-Cellar Act, Woodward saw only a modest increase in foreign-born residents—the current 3.6% share is well below the national average. The most significant demographic shift has been the growth of the Hispanic population, which rose from under 5% in 1990 to 17.4% by 2020. This wave was driven by labor demand in agriculture (wheat and cattle operations) and the oil and gas industry, with many families arriving from Texas and Mexico. The Southwest Woodward area, roughly bounded by 10th Street and Downs Avenue, became the primary landing zone for Hispanic families, with a cluster of Spanish-language churches, tiendas, and service businesses. Meanwhile, the Woodward Lake Estates subdivision (northeast of the city) attracted white professionals and energy-sector managers seeking larger lots and newer homes. The Black population has remained negligible at 0.5%, concentrated in a small pocket near the East Side around 2nd Street, a legacy of the pre-1960s railroad and meatpacking jobs. East/Southeast Asian residents (0.4%) are scattered, with no distinct enclave, and Indian-subcontinent residents are effectively zero.
The future
Woodward’s population is projected to remain stable or grow slowly, driven by domestic migration from rural Oklahoma and Texas rather than international immigration. The Hispanic share is likely to continue rising, potentially reaching 25-30% by 2040, as younger families move in and white residents age in place. This growth is not creating tribalized enclaves; instead, Hispanic families are dispersing into West Woodward (near the hospital and Walmart corridor) and the newer Pioneer Crossing development, indicating assimilation into the broader community. The white population, while still the majority at 74.5%, is aging, with a median age around 40 compared to 28 for Hispanics. The college-educated share (21.3%) is below the state average, suggesting that Woodward remains a blue-collar destination rather than a draw for knowledge workers. No significant growth is expected among Black, Asian, or Indian-subcontinent populations, as the local economy offers limited professional opportunities that would attract those groups.
For someone moving in now, Woodward is becoming a more diverse but still culturally conservative small city, where the Hispanic population is integrating into the existing social and economic fabric rather than forming separate enclaves. The city’s future hinges on the energy and agricultural sectors; if those remain stable, the population will hold steady with a gradually browner complexion. New arrivals should expect a community that values self-reliance, church attendance, and outdoor recreation, with a cost of living well below the national average.
* Values derived from national, state, county, city and local statistics and may differ in a specific area. Last updated: 2026-04-19T19:40:04.000Z
Narrative content on this page is AI-generated and may contain mistakes. Verify any details that matter before acting on them.
ReloMaps may earn a commission from affiliate links at no extra cost to you.