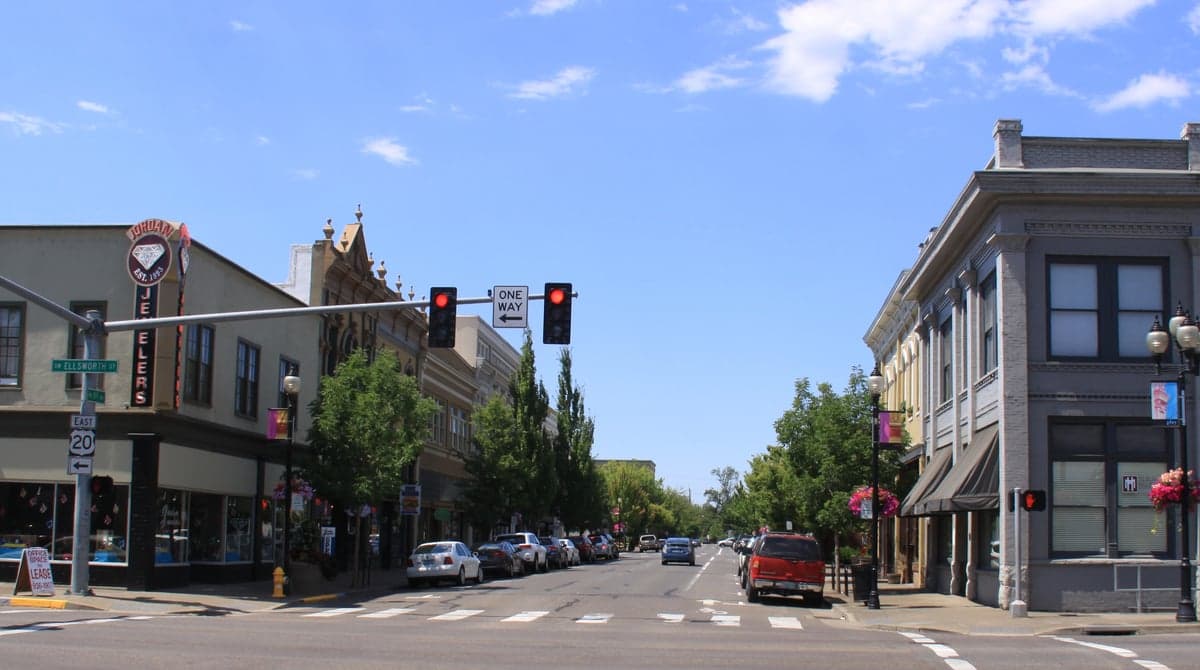
Photo: Wikipedia
Demographics of Albany, OR
Affluence Level in Albany, OR
A middle-class area roughly in line with national averages across income, home values, education, and employment.
People of Albany, OR
The people of Albany, Oregon today number 56,773, forming a predominantly white (76.7%) and increasingly Hispanic (15.3%) community with a modest foreign-born share of 3.6%. The city’s character is rooted in its Willamette Valley agricultural and industrial past, producing a population that is less college-educated (28.6%) than the state average and more likely to work in manufacturing, healthcare, and trades. Distinctive markers include a strong sense of local identity tied to the historic downtown and riverfront, a growing but still small East/Southeast Asian community (1.4%), and a very small Black (0.5%) and Indian-subcontinent (0.2%) presence, making Albany a place where demographic change is gradual rather than rapid.
How the city was settled and grew
Albany’s population history begins with the Donation Land Claim Act of 1850, which drew white settlers from the Midwest and Upper South to the fertile Willamette Valley. The city was platted in 1848 by Walter and Thomas Monteith, brothers from New York who claimed land along the Calapooia River. The original population was almost entirely of Northern European stock—English, German, and Irish—who built the Monteith Historic District, a neighborhood of Victorian homes that still anchors the city’s identity. The arrival of the Oregon & California Railroad in 1870 spurred a second wave of settlers, including a small number of Chinese laborers who worked on the rail lines and established a short-lived enclave near the current Water Avenue corridor. By 1900, Albany’s population had reached roughly 3,000, with the economy centered on flour milling, woolen mills, and later, the Albany Iron Works. The Downtown Commercial District grew as a hub for farm trade, drawing merchants and their families into the city core. No significant non-white population settled during this era; the city remained overwhelmingly white through the mid-20th century.
Modern era (post-1965)
The post-1965 period brought modest demographic shifts. The Hart-Cellar Act of 1965 opened immigration from Asia and Latin America, but Albany’s inland location and lack of a major university or high-tech anchor limited the influx. The most notable change was the growth of the Hispanic population, which rose from under 2% in 1980 to 15.3% by 2025, driven by agricultural labor in the surrounding Linn County farmlands and later by construction and food-processing jobs. These families concentrated in the South Albany area, particularly around Grand Prairie Road and the Oak Creek neighborhood, where older, more affordable housing stock and proximity to farm work drew settlement. The East/Southeast Asian community (1.4%) is small and dispersed, with no single ethnic enclave; families are scattered across North Albany and the Willamette Neighborhood, often employed in healthcare at Samaritan Albany General Hospital or in engineering at the nearby Hewlett-Packard campus in Corvallis. The Indian-subcontinent population (0.2%) is negligible, consisting mostly of professionals working at Oregon State University in Corvallis who choose Albany for lower housing costs. The Black population (0.5%) has remained flat for decades, with no historical migration stream to the city. Suburbanization after 1970 pushed growth into North Albany, a master-planned area across the Willamette River that attracted white families from the city core and from out-of-state relocations, reinforcing the area’s racial homogeneity.
The future
Albany’s population is heading toward gradual diversification, but at a slower pace than the Portland metro or the Willamette Valley as a whole. The Hispanic share is projected to reach 18-20% by 2040, driven by natural increase and continued in-migration for agricultural and service jobs, with South Albany likely becoming a more established Hispanic-majority area. The East/Southeast Asian and Indian-subcontinent populations will grow modestly as Oregon State University and the Corvallis tech corridor expand, but Albany will remain a secondary bedroom community rather than a primary destination for these groups. The white population share will continue to decline slowly, from 76.7% toward the low 70s, as older white residents age in place and younger, more diverse families move into entry-level neighborhoods. The city is not tribalizing into distinct enclaves—the small minority populations are too dispersed for that—but South Albany is emerging as a de facto Hispanic corridor, while North Albany and the Monteith Historic District remain overwhelmingly white and higher-income. The foreign-born share (3.6%) is unlikely to rise above 5-6% given the lack of a major refugee resettlement program or a large immigrant-employing industry beyond agriculture.
For someone moving in now, Albany is becoming a slightly more diverse, still predominantly white, middle-class city where demographic change is incremental rather than transformative. The city offers stability and affordability relative to Corvallis and Portland, but those moving here should expect a population that remains culturally and racially homogeneous in most neighborhoods, with the most visible diversity concentrated in South Albany’s Hispanic community. The next decade will see continued slow growth, a graying white population, and a steady but contained expansion of the Hispanic share—a trajectory that suits those seeking a predictable, low-disruption environment.
* Values derived from national, state, county, city and local statistics and may differ in a specific area. Last updated: 2026-05-01T03:30:14.000Z
Narrative content on this page is AI-generated and may contain mistakes. Verify any details that matter before acting on them.
ReloMaps may earn a commission from affiliate links at no extra cost to you.