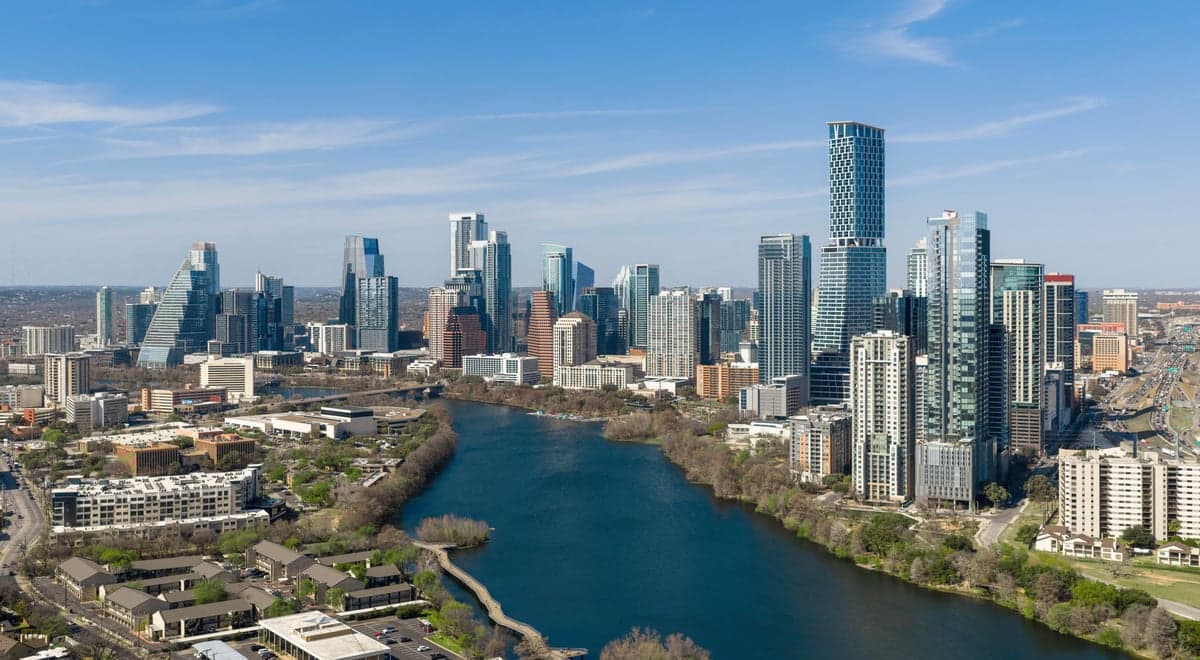
Photo: Wikipedia
Quality of Life in Austin, TX
Above-average quality of iife. The area offers a reasonable cost of living, decent mobility, and a mix of neighborhood amenities.
What does Quality of Life tell us?
Quality of Life blends cost of living, nearby amenities, socioeconomic signals, and neighborhood character. City-level scores represent the whole municipality; individual neighborhoods can differ.
What does this tell us?
Quality of Life blends cost of living, nearby amenities, socioeconomic signals, and neighborhood character. City-level scores represent the whole municipality; individual neighborhoods can differ.
Cost of Living
58% above national average
The Real Cost of Living in Austin, TX for 2026
| Tier | Individual | Family (4) |
|---|---|---|
| Survival | $26k | $50k |
| Comfortable | $100k | $146k |
| Luxury | $165k+ | $256k+ |
| Elite (Top 5%) | $218k+ | $338k+ |
62%
The Area Signal
A metric tracking the socioeconomic signals of the area.
Hobbies
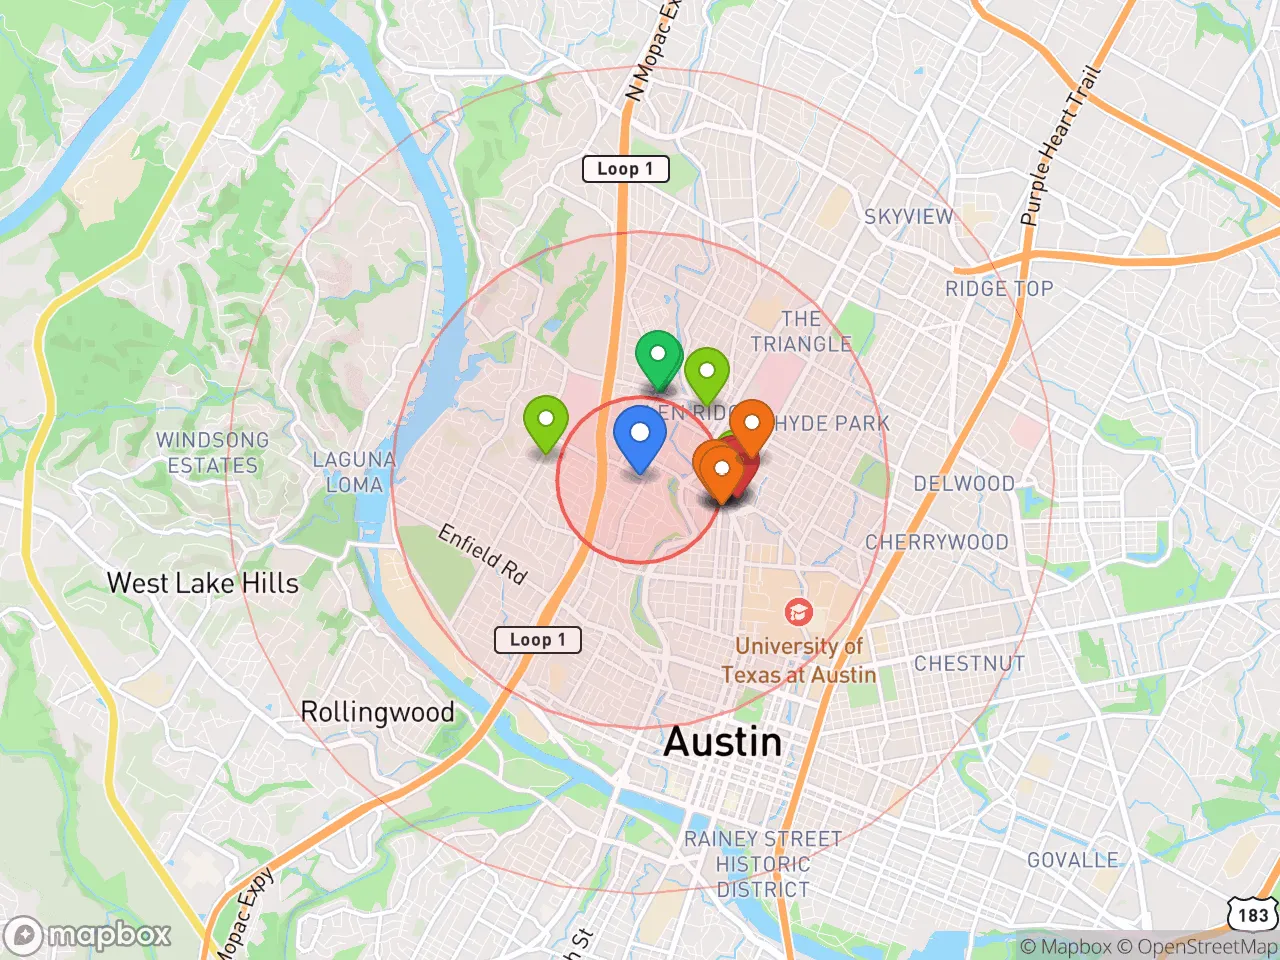
Explore the areaGroceries
7 within 10 miles
Gas
20 within 10 miles
Hospital
20 within 20 miles
Airport
AUS — Austin-Bergstrom International
Post Office
USPS — Austin, TX
Critical Amenities
Quality-of-Life Analysis
Austin’s quality of life is defined by a potent mix of high affluence, rapid population growth, and a culture that blends tech-industry ambition with laid-back Texas hospitality. The city’s cost of living index of 158 (100 = U.S. average) signals that it is significantly more expensive than the national norm, attracting a demographic that skews toward well-educated professionals, tech workers, and creatives who can absorb the higher costs. Median household incomes in Austin consistently outpace the state average, but the city’s prosperity is increasingly stratified, with long-time residents feeling the squeeze of rising prices and newcomers driving demand for housing and services.
Cost of living, housing affordability, and how Austin compares to nearby suburbs
Austin’s housing market is the primary driver of its elevated cost of living. The median home value sits at $512,700, roughly double the national median, while the median rent of $1,655 per month places significant pressure on renters. Compared to nearby suburbs like Round Rock (median home value ~$420,000) or Kyle (~$380,000), Austin proper commands a premium for its urban core and job density. The average commute time of 24 minutes is notably shorter than in many peer tech hubs (e.g., San Francisco’s 34 minutes), a fact that partially offsets the housing sticker shock for those who can afford to live close to work. However, affordability is a growing concern: the share of households spending more than 30% of income on housing has climbed above 40% in recent years, pushing many middle-income families toward outlying suburbs like Buda or Pflugerville for more space at a lower price point.
Amenities, schools, and what daily life feels like for families and professionals
Daily life in Austin revolves around a robust calendar of outdoor recreation, live music, and food culture. The city’s 300+ days of sunshine per year make Lady Bird Lake’s hike-and-bike trail and Barton Springs Pool year-round fixtures for active residents. For families, the Austin Independent School District (AISD) offers a mix of highly rated magnet programs—such as Liberal Arts and Science Academy (LASA) and McCallum Fine Arts Academy—but zoned elementary schools vary widely in performance, prompting many parents to consider private or charter options. The city’s rhythm is distinctly work-hard, play-hard: tech workers fill coffee shops and co-working spaces by 8 a.m., then transition to patio dining and live music venues on South Congress or Rainey Street by evening. Weekend farmers’ markets at Mueller and the Texas Farmers’ Market at Lakeline anchor a strong local-food scene, while the University of Texas at Austin adds a youthful, intellectual energy that keeps the city feeling dynamic rather than purely corporate.
Who thrives in Austin? The city is best suited to professionals earning above the median household income (around $85,000) who value outdoor access, cultural vibrancy, and a relatively short commute over low housing costs. Families with school-age children should carefully research AISD’s zoned schools or budget for private education, while retirees may find the heat and traffic challenging but the medical infrastructure (Dell Seton Medical Center, Ascension Seton) excellent. Those who struggle with Austin’s quality of life are typically renters on median incomes or below, for whom the housing market has become a barrier to stability. For the financially comfortable, however, Austin offers a rare combination of economic opportunity, natural beauty, and cultural richness that few other U.S. cities can match.
Crime in Austin, TX
WARNING: The crime statistics are unreliable for this jurisdiction. Local authorities have either not reported or under reported their data to the FBI. This could be due to bad intentions, incompetence or technical issues. Regardless, we suggest skepticism.
Significantly higher crime rates than 77% of comparable U.S. locations.
Violent CrimeViolent Crime Analysis
Property CrimeProperty Crime Analysis
Crime Analysis
Austin's overall safety picture is mixed, with a violent crime rate of 418.2 per 100,000 residents that sits above the national average but below some peer Sun Belt metros. The city's property crime rate of 3,076.6 per 100,000 is notably high, reflecting challenges common to fast-growing urban centers. However, these citywide averages mask significant neighborhood-level variation, and the local justice system's progressive orientation has become a central point of concern for residents evaluating long-term safety trends.
Crime in context
Compared to Texas as a whole, Austin's violent crime rate is roughly on par with the state average, while its property crime rate exceeds the state figure by approximately 15%. Nationally, Austin's violent crime rate is about 20% higher than the U.S. average, though it remains lower than cities like Houston or Dallas. A critical factor driving local concern is the influence of progressive district attorneys and judges in Travis County. This ideological approach, which prioritizes alternatives to incarceration and reduced sentencing for repeat offenders, has been linked to higher recidivism and a perception that criminals face minimal consequences. For example, the Travis County District Attorney's office has implemented policies that decline prosecution for certain low-level thefts and drug possessions, a stance that critics argue emboldens property crime rings operating across the metro area.
What residents experience
Daily life for Austinites involves navigating a city where property crime—particularly vehicle burglaries, package theft, and catalytic converter theft—is a routine annoyance. The property crime rate of 3,076.6 per 100,000 translates to roughly one property crime for every 32 residents annually. Violent crime, while less common, is concentrated in specific corridors: the Rundberg neighborhood, parts of East Austin, and areas near major highways like I-35. Residents in these zones report higher rates of aggravated assault and robbery. The progressive justice system's emphasis on "diversion" programs and cash bail reform means many offenders are released quickly, creating a cycle where victims see perpetrators return to their neighborhoods within days. This erodes trust in public safety institutions and pushes some residents toward private security measures like neighborhood patrols and camera networks.
Neighborhood-level safety varies dramatically. Westlake, Rollingwood, and the Circle C area in Southwest Austin report violent crime rates below 150 per 100,000, while the 78702 and 78744 zip codes see rates exceeding 600 per 100,000. Property crime is more evenly distributed, though downtown and the University of Texas campus area experience elevated theft rates. Prospective residents should research specific precinct-level data from the Austin Police Department's crime maps and consider that the city's liberal judicial philosophy means even low-crime neighborhoods are not insulated from regional property crime trends driven by lenient prosecution policies.
* Values derived from national, state, county, city and local statistics and may differ in a specific area. Last updated: 2026-04-22T01:53:59.000Z
Narrative content on this page is AI-generated and may contain mistakes. Verify any details that matter before acting on them.
ReloMaps may earn a commission from affiliate links at no extra cost to you.