Quality of Life in Bozeman, MT
Above-average quality of iife. The area offers a reasonable cost of living, decent mobility, and a mix of neighborhood amenities.
What does Quality of Life tell us?
Quality of Life blends cost of living, nearby amenities, socioeconomic signals, and neighborhood character. City-level scores represent the whole municipality; individual neighborhoods can differ.
What does this tell us?
Quality of Life blends cost of living, nearby amenities, socioeconomic signals, and neighborhood character. City-level scores represent the whole municipality; individual neighborhoods can differ.
Cost of Living
70% above national average
The Real Cost of Living in Bozeman, MT for 2026
| Tier | Individual | Family (4) |
|---|---|---|
| Survival | $26k | $48k |
| Comfortable | $114k | $167k |
| Luxury | $144k+ | $224k+ |
| Elite (Top 5%) | $196k+ | $304k+ |
48%
The Area Signal
A metric tracking the socioeconomic signals of the area.


Hobbies
Explore the areaGroceries
5 within 10 miles
Gas
0 within 10 miles
Hospital
3 within 20 miles
Airport
SLC — Salt Lake City International
Post Office
USPS — Bozeman, MT
Critical Amenities
Quality-of-Life Analysis
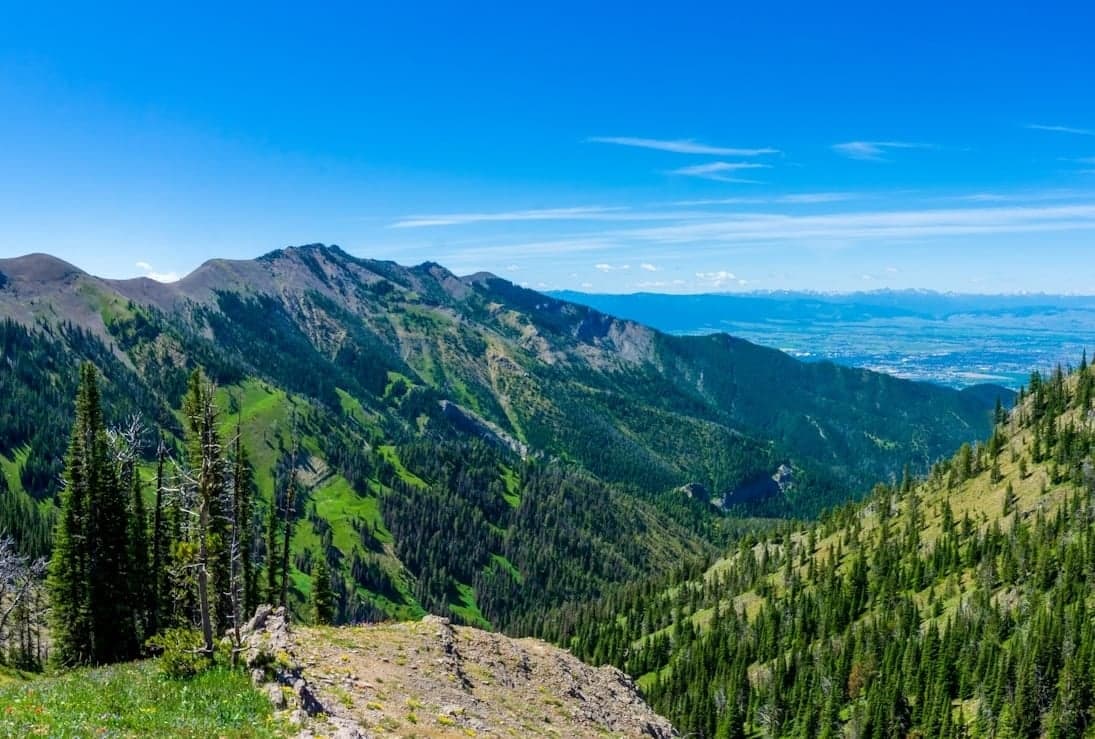
Bozeman, Montana, has transformed from a quiet college town into one of the fastest-growing micropolitan areas in the West, drawing a mix of outdoor enthusiasts, remote tech workers, and second-home buyers. The city’s affluence is evident in its cost of living index of 170 (70% above the U.S. average), a figure that reflects both its desirability and the economic pressures reshaping daily life for longtime residents. The population skews younger and more educated than the Montana average, with a median age of roughly 32, driven by Montana State University’s 17,000 students and a steady influx of professionals seeking direct access to skiing, fly-fishing, and hiking.
Cost of living, housing affordability, and how Bozeman compares to nearby areas
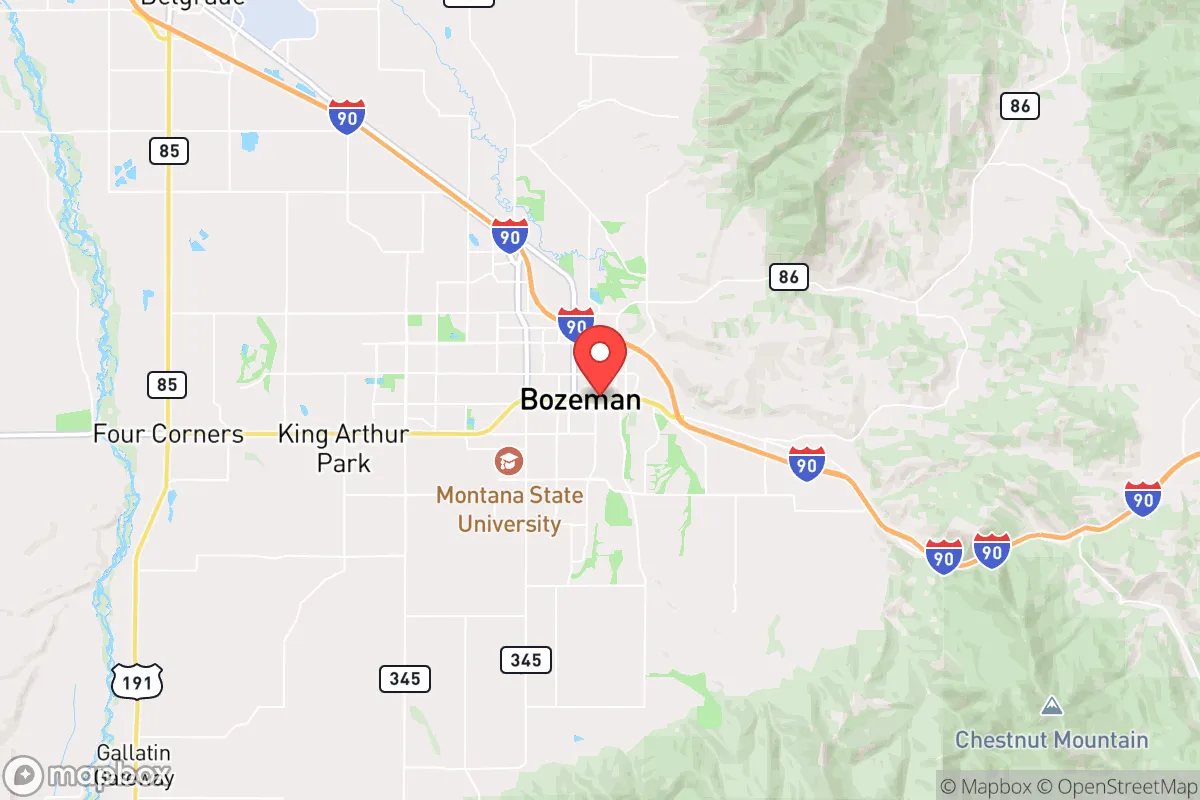
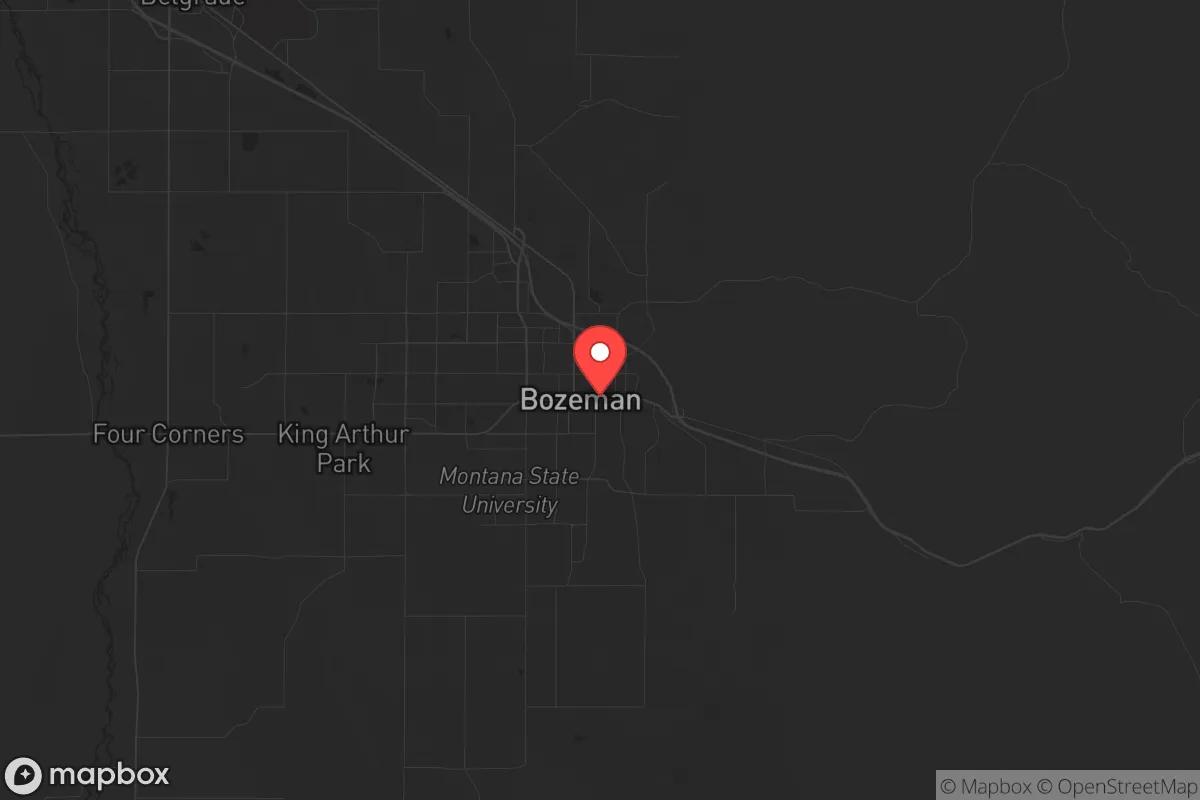
Bozeman’s cost of living is the highest in Montana and rivals that of Boulder, Colorado, or Bend, Oregon. The median home value sits at $614,900, more than double the national median and roughly 40% higher than in nearby Belgrade (median ~$440,000) or Livingston (~$500,000). Renters face a median monthly rent of $1,611, which is about 30% above the national average but still below the $2,000+ rents common in Bozeman’s newer luxury apartment complexes. The average commute of 15 minutes is remarkably short for a metro area of this size—a direct benefit of the city’s compact layout and the fact that many workers live within a few miles of downtown or the university. However, for households earning the local median income of roughly $72,000, buying a home at current prices requires a down payment of over $120,000, pushing many first-time buyers to neighboring communities like Four Corners or Manhattan, Montana.
What daily life is like for families, outdoor access, and local schools
Daily life in Bozeman revolves around a tight-knit downtown core anchored by Main Street’s independent bookstores, breweries, and farm-to-table restaurants. The Bozeman School District (K-12) consistently ranks among Montana’s best, with Bozeman High School graduating over 90% of its students and offering a robust International Baccalaureate program. For families, the city’s 15 community parks, the year-round Bogert Pool, and the Montana Science Center provide structured recreation. Outdoor access is the defining amenity: Bridger Bowl Ski Area is 16 miles north, Big Sky Resort is 45 miles south, and the Gallatin River offers world-class trout fishing within a 20-minute drive. The rhythm of the week is shaped by farmers’ markets (May–October), Montana State Bobcats football games, and a surprisingly active arts scene at the Emerson Center for the Arts & Culture. Traffic on Main Street and Interstate 90 can back up during peak tourist seasons (July–August and December–March), but the short commute means most errands remain under 20 minutes.
Bozeman is best suited for people who can absorb its high housing costs in exchange for immediate access to world-class outdoor recreation and a vibrant, educated community. Remote workers earning six-figure salaries, dual-income professional families, and retirees with significant equity from higher-cost markets will find the lifestyle rewarding. Those on fixed incomes or in service-sector jobs may struggle with affordability and should consider nearby towns like Belgrade or Three Forks, where housing is cheaper but the commute to Bozeman’s amenities remains under 30 minutes. The city’s growth shows no signs of slowing, but its small-town feel and 15-minute commute remain intact for now—a balance that continues to attract newcomers despite the price tag.
Crime in Bozeman, MT
Generally safer than 65% of comparable U.S. locations.
Violent CrimeViolent Crime Analysis
Property CrimeProperty Crime Analysis
Crime Analysis
Bozeman, Montana, presents a mixed safety profile that prospective residents should weigh carefully. The city’s violent crime rate stands at 380 incidents per 100,000 residents, while property crime reaches 1,589.5 per 100,000 — figures that exceed national averages and signal a need for heightened awareness, particularly regarding theft and vehicle-related offenses. These numbers place Bozeman in a cautionary category for a city of its size and rapid growth trajectory.
Crime in context
When compared to Montana’s statewide violent crime rate of roughly 300 per 100,000, Bozeman’s 380 per 100,000 is notably higher. The national violent crime average hovers around 380 per 100,000, meaning Bozeman sits right at the U.S. benchmark for violent offenses. Property crime, however, tells a more concerning story: the national average is approximately 1,954 per 100,000, but Bozeman’s 1,589.5 per 100,000 is still above the Montana state average of roughly 1,400 per 100,000. This elevated property crime rate is driven largely by theft from vehicles, bicycle theft, and burglaries — common issues in a fast-growing college town with a transient population. The city’s proximity to Yellowstone National Park and its status as a regional outdoor recreation hub also contribute to a steady flow of visitors, which can increase opportunities for opportunistic crime.
What residents experience
Daily life in Bozeman involves practical precautions rather than constant fear. Violent crime is not random or widespread; it tends to cluster in specific contexts, such as domestic disputes or incidents tied to alcohol consumption near downtown bars. Property crime is the primary daily concern, with unlocked cars, bicycles left unattended, and packages taken from porches being the most common complaints. Residents quickly learn to lock vehicles even in driveways, secure bikes with high-quality locks, and avoid leaving valuables visible. The Bozeman Police Department maintains a visible presence and publishes regular crime maps, but response times can lag during peak tourist seasons or major events like Montana State University football games. The presence of progressive judicial philosophies in Gallatin County has been noted by some residents as a factor in repeat property offenders cycling through the system quickly, which can erode public confidence in deterrence.
Neighborhood-level variation
Safety is not uniform across Bozeman. The area immediately surrounding Montana State University and the downtown core sees the highest concentration of property crime, particularly bicycle theft and vehicle break-ins. The northeast quadrant, including newer subdivisions near the Bozeman Yellowstone International Airport, generally reports lower crime rates. The historic South Side and the area near the fairgrounds have moderate crime levels, with occasional spikes in vandalism and theft. The most affluent neighborhoods west of 19th Avenue and north of Main Street tend to have the lowest incident rates, though no area is immune to property crime. For those considering a move, consulting the Bozeman Police Department’s online crime map and speaking with local property managers about specific blocks can provide a clearer picture than citywide averages alone.
* Values derived from national, state, county, city and local statistics and may differ in a specific area. Last updated: 2026-04-19T06:52:23.000Z
Narrative content on this page is AI-generated and may contain mistakes. Verify any details that matter before acting on them.
ReloMaps may earn a commission from affiliate links at no extra cost to you.