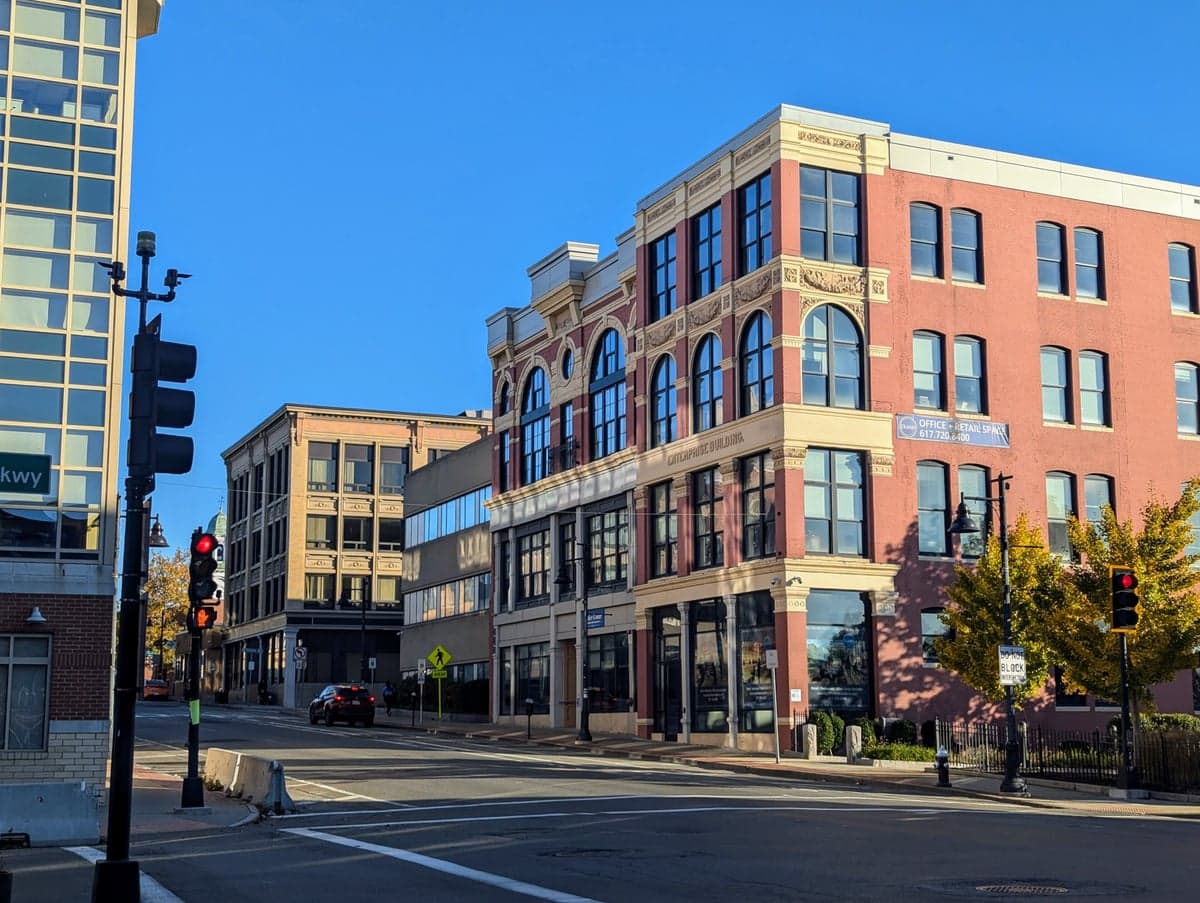
Photo: Wikipedia
Demographics of Brockton, MA
Affluence Level in Brockton, MA
A middle-class area roughly in line with national averages across income, home values, education, and employment.
People of Brockton, MA
Brockton, Massachusetts, is a dense, majority-minority city of 105,080 residents where Black residents make up the largest single group at 37.0%, followed by non-Hispanic whites at 26.6% and Hispanics at 12.9%. Its population is notably less college-educated than the state average (21.3% vs. roughly 45% statewide), and its foreign-born share of 12.8% reflects a steady but moderate immigration stream. The city’s identity is shaped by a working-class industrial past, a sharp racial transition over the past 50 years, and a present-day reality of distinct ethnic enclaves that rarely mix socially.
How the city was settled and grew
Brockton’s original population was overwhelmingly Yankee and English, drawn by water-powered mills along the Salisbury River in the early 19th century. The city’s real boom came after the Civil War, when it became the world’s largest shoe-manufacturing center — by 1900, one in every 20 shoes sold in America was made in Brockton. That industry attracted successive waves of European immigrants: first Irish Catholics who settled in the Campello neighborhood around the shoe factories, then Italians who clustered in Downtown near the train depot, and later Swedes and Poles who built homes in Montello and the West Side. By 1920, Brockton was a solidly ethnic, blue-collar city of 66,000, with each group maintaining its own parish church and social clubs. The shoe industry collapsed in the 1950s and 1960s, triggering white flight to surrounding suburbs like Easton and Bridgewater.
Modern era (post-1965)
The 1965 Hart-Cellar Act and the simultaneous decline of manufacturing reshaped Brockton’s population dramatically. Black families, primarily from the rural South and later from Boston’s Roxbury neighborhood, moved into the East Side and Downtown neighborhoods that whites had abandoned. By 1980, the city was roughly 16% Black; by 2000, that figure had risen to 26%; today it stands at 37.0%. The Hispanic population, mostly Puerto Rican and Dominican, grew from negligible to 12.9% over the same period, concentrating in Campello and the West Side. East and Southeast Asian residents (1.9%) are a small but visible presence, with Vietnamese and Cambodian families living primarily in Montello. The Indian-subcontinent population remains tiny at 0.2%. The white population, which was over 90% in 1970, has fallen to 26.6% — and those who remain are disproportionately elderly, concentrated in the West Side and Avon Heights areas. The city’s college-attainment rate of 21.3% is among the lowest in the Boston metro area, reflecting the loss of middle-class professional families to the suburbs.
The future
Brockton’s population is likely to continue its trajectory toward a Black-majority city, with the Hispanic share also growing steadily. The white population is aging and not being replaced by younger white families, who continue to choose suburbs like Raynham or Taunton. The East/Southeast Asian and Indian communities are too small to significantly alter the city’s ethnic balance. The city is not homogenizing into a single melting pot; rather, it is tribalizing into distinct enclaves — the East Side remains heavily Black, Campello is increasingly Hispanic, and the West Side retains a white elderly core. The foreign-born share (12.8%) is below the state average (17.3%) and is not accelerating, suggesting that Brockton is not a primary landing point for new immigrants compared to Boston or Lowell. The biggest demographic wildcard is whether the city can attract or retain the college-educated families needed to stabilize its tax base — without that, the population may continue to skew younger, poorer, and less educated.
For someone moving to Brockton today, the city offers a genuinely diverse, working-class environment with strong community institutions in each neighborhood, but also significant challenges: low educational attainment, a shrinking tax base, and limited economic mobility. It is not a gentrifying city like Somerville or a booming immigrant hub like Lynn — it is a post-industrial city still searching for its next economic identity, with a population that reflects that uncertainty.
* Values derived from national, state, county, city and local statistics and may differ in a specific area. Last updated: 2026-05-01T19:04:48.000Z
Narrative content on this page is AI-generated and may contain mistakes. Verify any details that matter before acting on them.
ReloMaps may earn a commission from affiliate links at no extra cost to you.