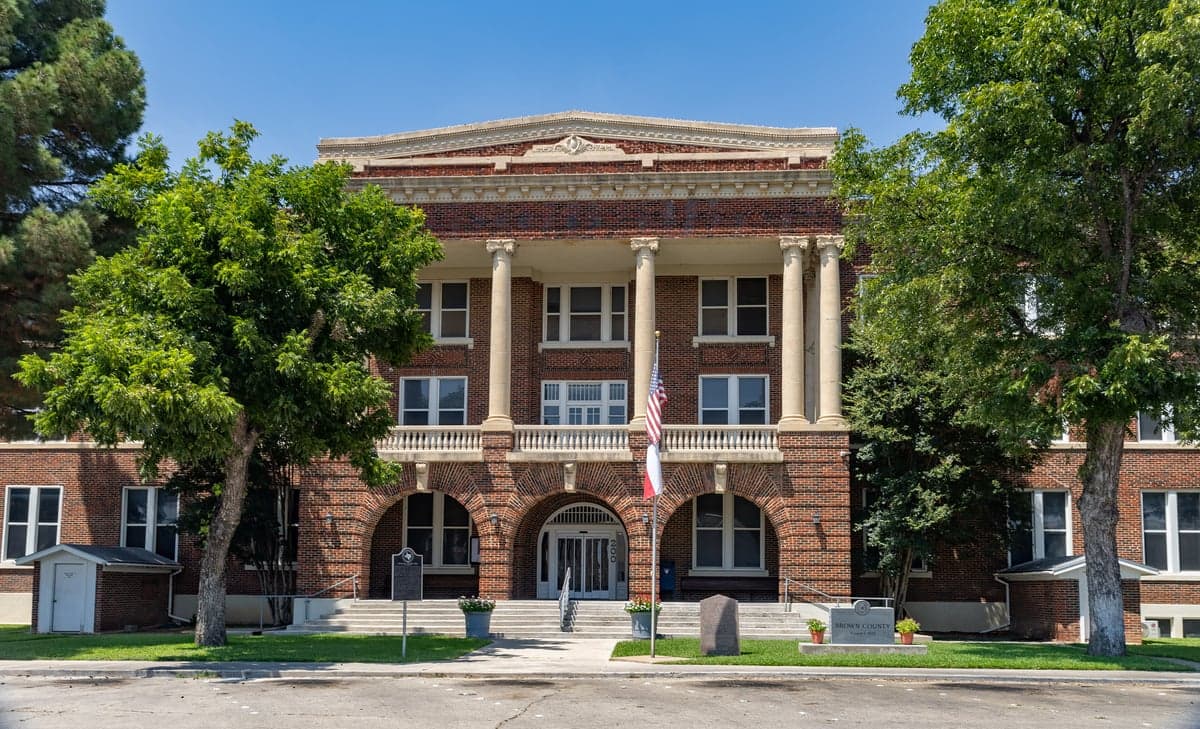
Photo: Wikipedia
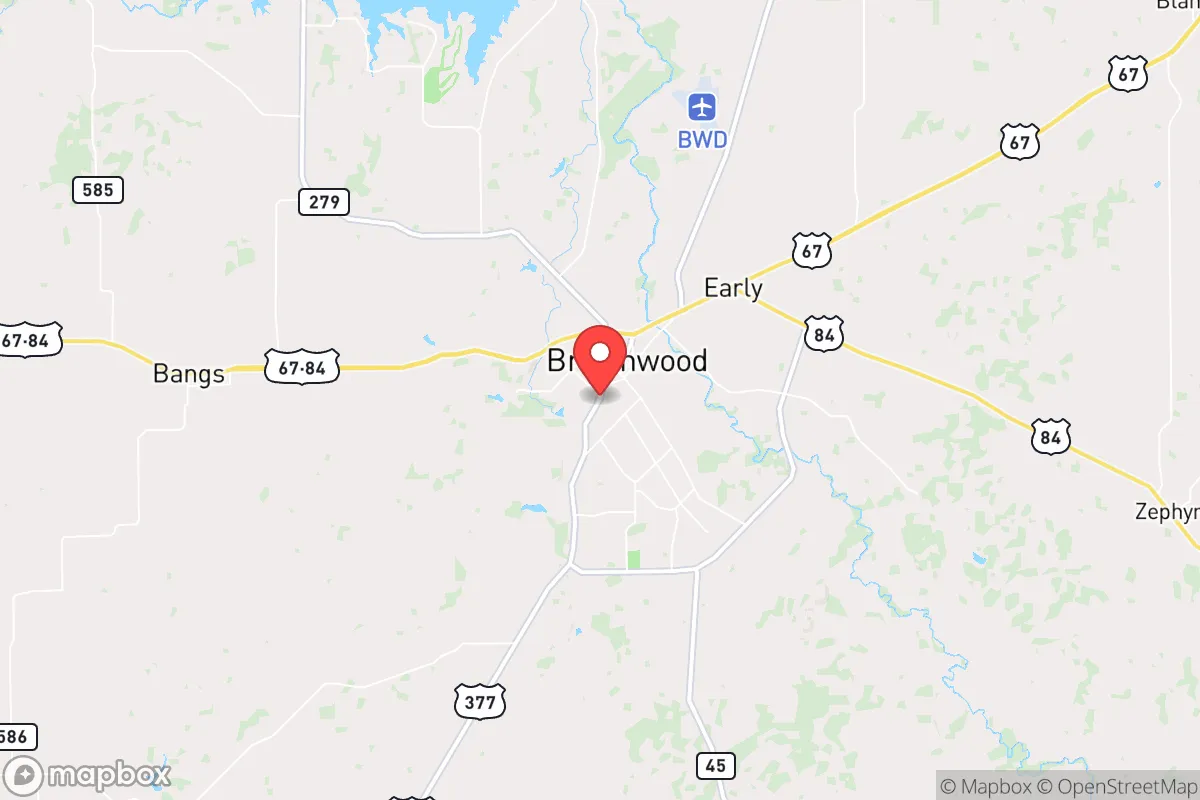
Demographics of Brownwood, TX
Affluence Level in Brownwood, TX
A below-average socioeconomic profile. Incomes, home values, and educational attainment trail the U.S., with higher poverty and unemployment.
People of Brownwood, TX
The people of Brownwood, Texas, today number 18,805, forming a community that is predominantly White (62.4%) with a substantial Hispanic minority (29.1%) and small Black (4.6%) and East/Southeast Asian (0.6%) populations. The city’s character is rooted in its role as a regional trade and education hub for the surrounding ranching and agricultural counties, with a notably low foreign-born share of 3.5% and a college-educated rate of 18.7%. Distinctive identity markers include a strong sense of local pride centered on Howard Payne University and a cultural conservatism that reflects the broader West Texas ethos. The population is relatively stable, with modest growth driven by Hispanic families and some retirees, while younger, college-bound residents often leave for larger metros.
How the city was settled and grew
Brownwood’s human history begins with its founding in 1856 as a trading post on the Pecan Bayou, named after early settler Henry S. Brown. The original population was drawn by the promise of fertile bottomland for cotton farming and the establishment of a county seat for Brown County. The arrival of the Gulf, Colorado and Santa Fe Railway in 1885 transformed the settlement into a regional shipping center, attracting Anglo-American farmers, merchants, and railroad workers who built the Camp Bowie Historic District and the Downtown Commercial District with brick storefronts and Victorian homes. A second major wave came during World War II with the construction of Camp Bowie, a massive Army training base that brought thousands of soldiers and support personnel, many of whom stayed after the war. This influx spurred development in the North Brownwood area, where modest bungalows and post-war housing tracts were built for returning veterans and their families. The city’s growth plateaued after the 1950s as the base downsized and the regional economy shifted from agriculture to education and healthcare.
Modern era (post-1965)
After the 1965 Immigration and Nationality Act, Brownwood saw only modest demographic change compared to Texas’s large cities. The Hispanic population grew steadily from the 1970s onward, driven by Mexican-American families moving from the Rio Grande Valley and South Texas for work in construction, meatpacking, and the local Howard Payne University service sector. These families concentrated in the South Brownwood neighborhood, near the industrial corridor along US-377, and in the East Brownwood area around the former Camp Bowie site, where affordable housing stock attracted younger households. The White population, while still the majority, has aged and declined slightly as younger generations moved to Dallas-Fort Worth or Austin for professional opportunities. The Black population, historically small and centered near the West Brownwood area around the old segregated school sites, has remained stable at around 4.6% since the 1990s. The East/Southeast Asian community, at 0.6%, is tiny and consists mostly of families connected to Howard Payne University or medical professionals at Brownwood Regional Medical Center, with no distinct ethnic enclave. The Indian subcontinent population is effectively zero, reflecting the city’s lack of tech or professional-service sectors that attract such immigrants. The foreign-born share of 3.5% is well below the Texas average of 17%, indicating limited recent international immigration.
The future
Brownwood’s population is heading toward gradual Hispanicization, with the Hispanic share projected to approach 35-40% by 2040, driven by higher birth rates and continued domestic in-migration from South Texas. The White population will likely continue its slow numerical decline, while the Black and Asian shares remain static. The city is not tribalizing into distinct enclaves—neighborhoods like South Brownwood and East Brownwood are becoming more mixed as older White residents age out and Hispanic families move in. The immigrant community is small and plateauing, with most Hispanic growth coming from U.S.-born families rather than new arrivals. The next 10-20 years will likely see a younger, more Hispanic population base, but the overall size will remain near 19,000-20,000, as outmigration of college graduates offsets natural increase. The city’s character will remain conservative and family-oriented, with a growing bilingual presence in schools and local businesses.
For someone moving in now, Brownwood is becoming a more Hispanic-influenced but still predominantly White, stable, and culturally conservative community. It offers a low-cost, low-crime environment with a strong sense of local identity, but limited ethnic diversity and few opportunities for immigrants or professionals outside of healthcare and education. The population is aging in place among the White cohort while younger Hispanic families provide demographic renewal, making the city a quiet, family-focused alternative to the fast-growing Texas metros.
* Values derived from national, state, county, city and local statistics and may differ in a specific area. Last updated: 2026-04-15T06:21:19.000Z
Narrative content on this page is AI-generated and may contain mistakes. Verify any details that matter before acting on them.
ReloMaps may earn a commission from affiliate links at no extra cost to you.