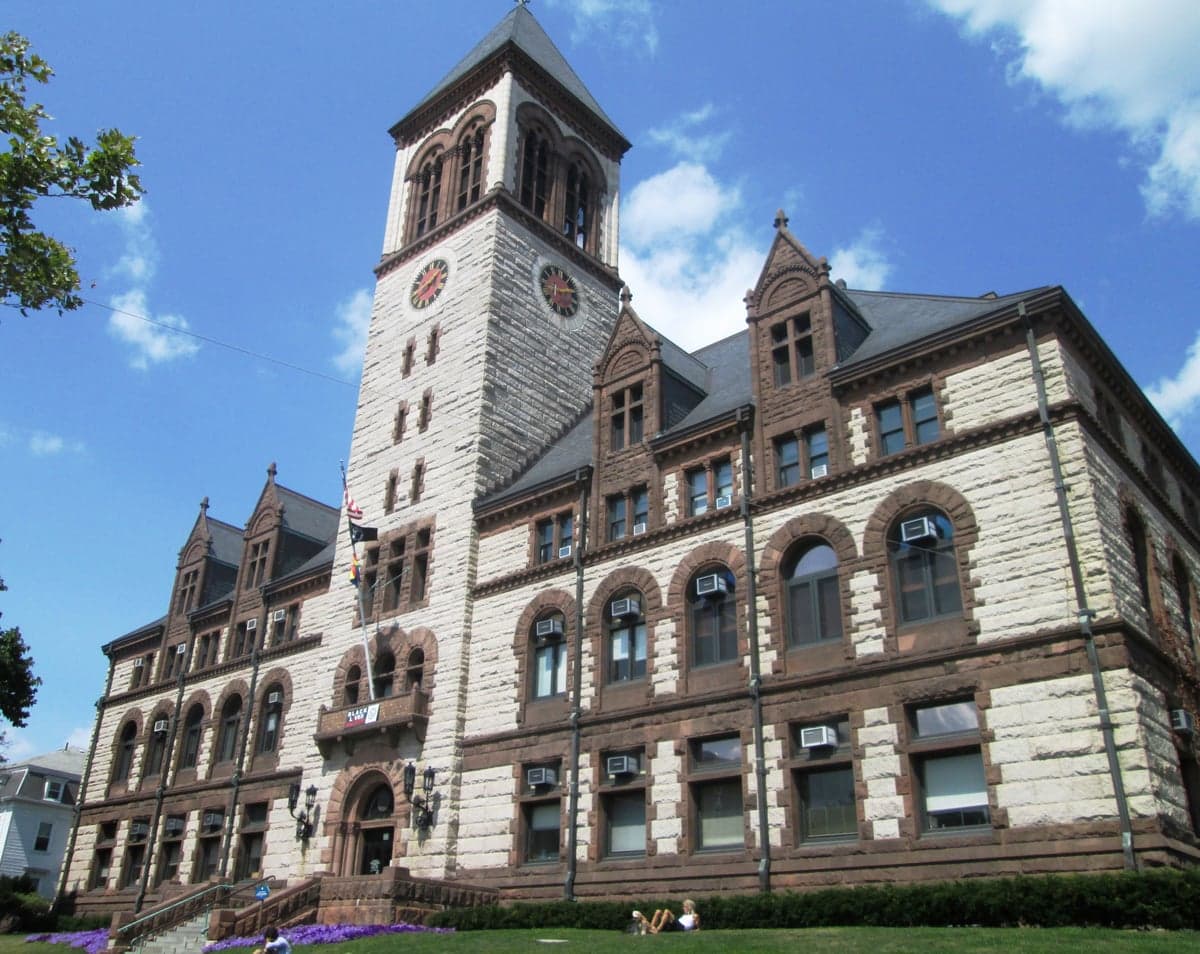
Photo: Wikipedia
Quality of Life in Cambridge, MA
A livable area that tracks near national norms for affordability, walkability, and neighborhood health.
What does Quality of Life tell us?
Quality of Life blends cost of living, nearby amenities, socioeconomic signals, and neighborhood character. City-level scores represent the whole municipality; individual neighborhoods can differ.
What does this tell us?
Quality of Life blends cost of living, nearby amenities, socioeconomic signals, and neighborhood character. City-level scores represent the whole municipality; individual neighborhoods can differ.
Cost of Living
189% above national average
The Real Cost of Living in Cambridge, MA for 2026
| Tier | Individual | Family (4) |
|---|---|---|
| Survival | $44k | $82k |
| Comfortable | $175k | $257k |
| Luxury | $228k+ | $354k+ |
| Elite (Top 5%) | $302k+ | $468k+ |
49%
The Area Signal
A metric tracking the socioeconomic signals of the area.


Hobbies
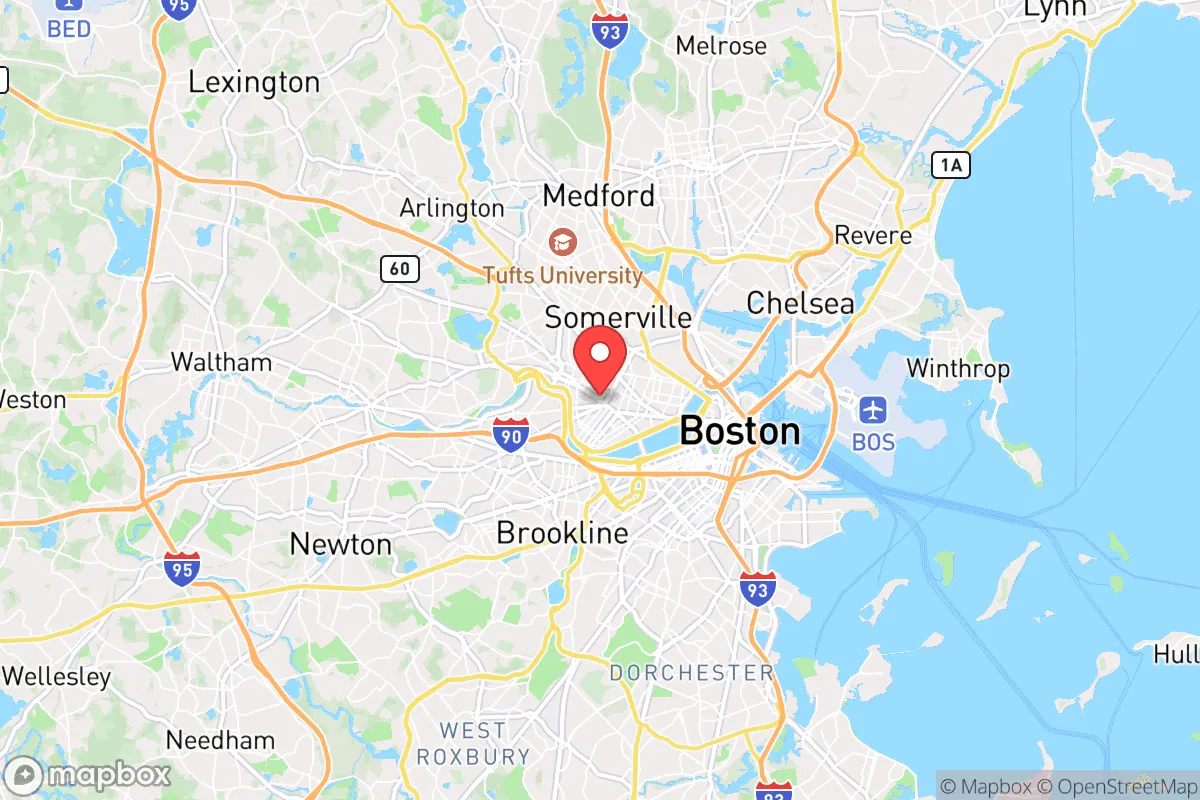
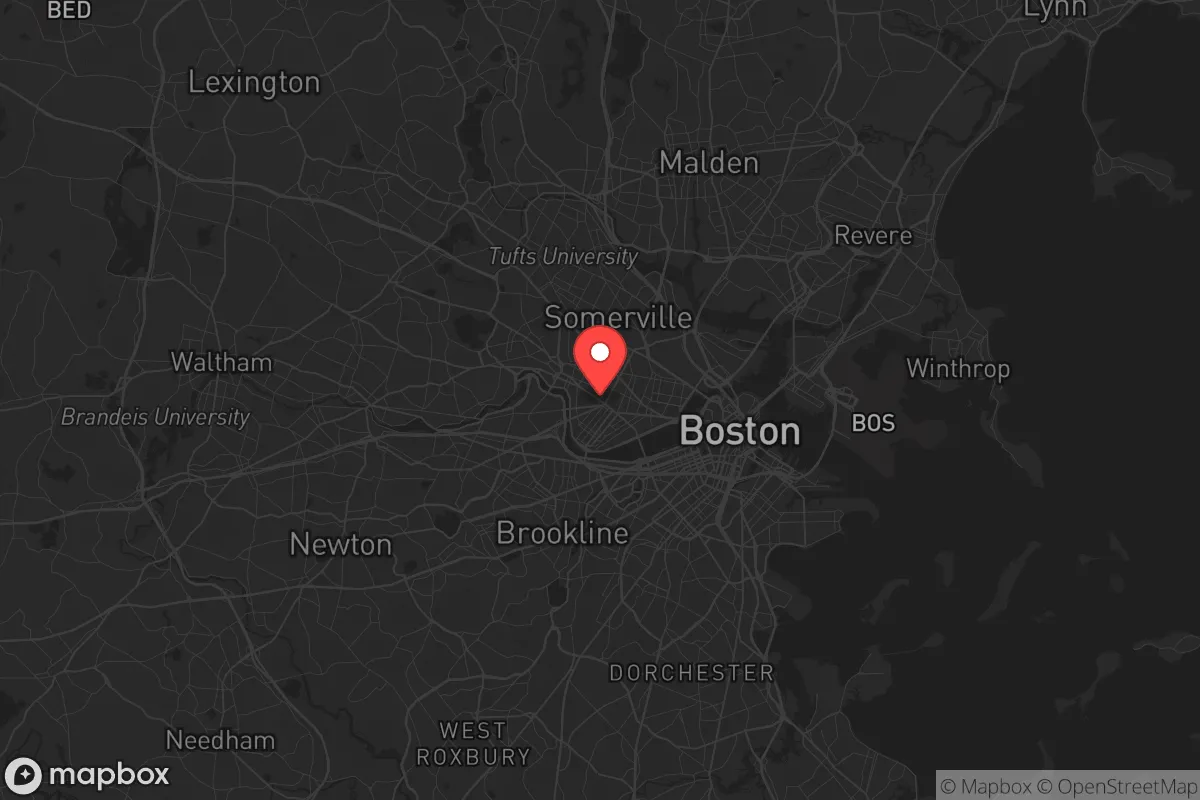
Explore the areaGroceries
4 within 10 miles
Gas
0 within 10 miles
Hospital
3 within 20 miles
Airport
BOS — Boston Logan International
Post Office
USPS — Boston, MA
Critical Amenities
Quality-of-Life Analysis
Cambridge, Massachusetts, is one of the most affluent and educated cities in the United States, with a cost of living index of 289—nearly three times the national average. The city’s population is dominated by students, academics, and professionals in biotech and tech, drawn by Harvard University and MIT. This creates a dense, intellectually charged atmosphere where the median age hovers around 30, and over 70% of residents hold a bachelor’s degree or higher.
Cost of living, housing, and affordability compared to Boston
Cambridge’s housing market is among the priciest in Greater Boston. The median home value sits at $1,040,500, and the median rent is $2,742 per month—roughly 20% higher than in nearby Somerville and 10% higher than in Boston’s Back Bay. For context, a one-bedroom apartment in Central Square often rents for $2,400–$2,800, while a two-bedroom in Harvard Square can exceed $3,500. The average commute time is 26 minutes, slightly below the Boston metro average, thanks to the MBTA Red Line and extensive bus network. However, the city’s high property taxes (about 1.1% of assessed value) and a 6.25% state sales tax add to the financial burden. Renters face a vacancy rate below 3%, making competition fierce. For buyers, the market is dominated by condos and multi-family homes, with single-family houses often exceeding $1.5 million. Compared to suburban towns like Arlington or Watertown, Cambridge offers walkability and transit access but demands a significant premium.
What daily life is like for families, students, and professionals
Daily life in Cambridge revolves around its dense, walkable neighborhoods—Harvard Square, Central Square, and Kendall Square—each with distinct character. The city boasts over 60 public parks, including the Charles River Reservation for jogging and kayaking, and the 120-acre Fresh Pond Reservation. The Cambridge Public School District is highly rated, with Cambridge Rindge and Latin School offering a rigorous International Baccalaureate program. For families, the city provides robust after-school programs and a strong sense of community in areas like West Cambridge. Students and professionals benefit from a 24-hour transit system (the Red Line runs until 1:30 AM) and a thriving restaurant scene with over 400 eateries, from cheap dumpling spots in Central Square to upscale farm-to-table dining in Inman Square. The city’s cultural calendar is packed: the Cambridge Science Festival in April, the Harvard Square Mayfair, and year-round performances at the American Repertory Theater. However, parking is notoriously difficult—monthly garage fees run $250–$400—and noise from student parties can be an issue near Harvard and MIT campuses.
Cambridge is best suited for professionals in biotech, academia, or tech who can afford its high housing costs and value walkability over space. Families with children will find excellent schools and green spaces, but should budget for a premium on larger apartments or condos. Retirees on fixed incomes may struggle unless they own property outright. The city’s relentless pace and high density can overwhelm those seeking quiet suburban life, but for anyone who thrives on intellectual energy, cultural density, and a car-free lifestyle, Cambridge offers an unmatched quality of life in the Boston metro area.
Crime in Cambridge, MA
Crime rates similar to the national median for U.S. locations.
Violent CrimeViolent Crime Analysis
Property CrimeProperty Crime Analysis
Crime Analysis
Cambridge, Massachusetts, reports a violent crime rate of 401.2 incidents per 100,000 residents and a property crime rate of 2,445.9 per 100,000. These figures place the city above both the Massachusetts state average and the national median for violent crime, while property crime aligns closely with national norms. The city’s safety profile is shaped by its dense urban environment, large student population, and the progressive criminal justice policies of Middlesex County, which critics argue prioritize offender rehabilitation over public safety.
Crime in context
Cambridge’s violent crime rate is roughly 15% higher than the national average of approximately 350 per 100,000, and significantly above the Massachusetts state rate of about 300 per 100,000. Property crime, at 2,445.9 per 100,000, is comparable to the national figure of 2,400 per 100,000 but exceeds the state average of roughly 1,800 per 100,000. The city benefits from a well-funded police department and community policing initiatives, yet the broader Middlesex County justice system—led by District Attorney Marian Ryan—has been characterized by progressive policies such as diversion programs and reduced bail requirements. Critics contend that these approaches, while intended to reduce incarceration, result in more offenders remaining on the street, potentially elevating recidivism and undermining deterrence. This ideological framework is a key factor for readers evaluating safety, as it directly impacts the likelihood of repeat offenses and the swiftness of justice for victims.
What residents experience
Daily life in Cambridge involves navigating a mix of low-level property crime and sporadic violent incidents. Theft from vehicles and bicycles is common, particularly near Harvard Square and Central Square, where high foot traffic creates opportunities for petty crime. Aggravated assault accounts for the majority of violent offenses, while robberies and burglaries occur less frequently but are concentrated in commercial corridors. Residents often report feeling safe in well-lit, busy areas during the day, but nighttime safety varies sharply by location. The presence of a large transient population and open-air drug markets in parts of Central Square and the Port neighborhood contributes to a perception of disorder. For families and professionals, the trade-off is living in a vibrant, walkable city with strong amenities while accepting a higher baseline of property crime and the systemic risks associated with a lenient prosecutorial environment.
Neighborhood-level variation is pronounced. West Cambridge and North Cambridge—more residential, with higher home values and lower population density—consistently report the fewest incidents. In contrast, Area 4 (the Port) and Central Square experience elevated rates of both property and violent crime, driven by socioeconomic disparities and concentrated poverty. Harvard and MIT campuses maintain their own police forces and relatively low crime rates, though off-campus areas near student housing see higher theft and vandalism. Prospective residents should research block-level data, as a single street can differ markedly from its surroundings. Overall, Cambridge demands heightened awareness compared to suburban alternatives, particularly for those concerned about the downstream effects of progressive justice policies on community safety.
* Values derived from national, state, county, city and local statistics and may differ in a specific area. Last updated: 2026-04-15T23:38:45.000Z
Narrative content on this page is AI-generated and may contain mistakes. Verify any details that matter before acting on them.
ReloMaps may earn a commission from affiliate links at no extra cost to you.