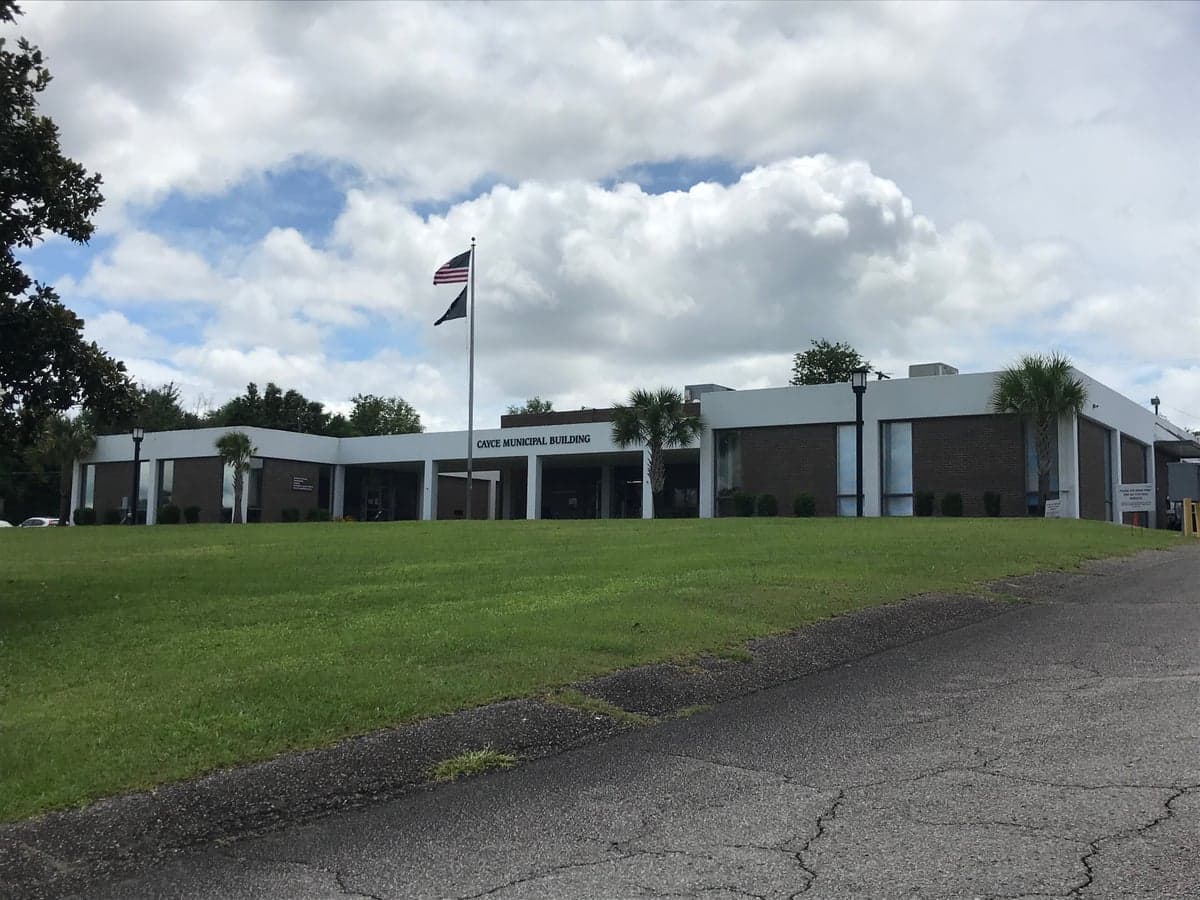
Photo: Wikipedia
Demographics of Cayce, SC
Affluence Level in Cayce, SC
A below-average socioeconomic profile. Incomes, home values, and educational attainment trail the U.S., with higher poverty and unemployment.
People of Cayce, SC
The people of Cayce, South Carolina today form a compact, historically-rooted community of 13,718 residents, characterized by a majority-white population (58.0%) alongside a substantial Black minority (26.7%) and a growing Hispanic presence (9.6%). The city is notably less diverse than the broader Columbia metro area in terms of foreign-born residents—just 3.7% compared to the national average—and has a college attainment rate of 30.5%, slightly below the state median. Cayce’s identity is shaped by its position as a working-to-middle-class suburb of Columbia, with a strong sense of local history tied to the Congaree River and the railroad, rather than the transient, fast-growth character of many Sun Belt suburbs.
How the city was settled and grew
Cayce’s population history begins not with colonial settlement but with the railroad. The area was originally part of a larger land grant along the Congaree River, but the city’s founding as a distinct community dates to the 1840s, when the Columbia-to-Charleston railroad line established a depot here. The first wave of permanent residents were railroad workers and their families—predominantly white laborers of English, Scots-Irish, and German descent—who built small homes near the tracks in what is now the Historic Cayce District, centered around State Street and Knox Abbott Drive. By the late 19th century, the city’s economy diversified with the arrival of textile mills, most notably the Guignard Brick Works and the Cayce Cotton Mill, which drew a second wave of white mill workers from the rural upstate. These workers settled in the Mill Village neighborhood, a grid of modest frame houses still standing today near the intersection of Frink Street and Meeting Street. A smaller but significant Black population also formed during this era, composed of freedmen who found work as domestic laborers, mill hands, and riverboat workers. They established a separate enclave in the Brookland area (now part of West Columbia, but historically tied to Cayce’s southern edge), where a tight-knit community built churches and schools on land often purchased from white landowners. By 1900, Cayce’s population was roughly 70% white and 30% Black, a ratio that held steady through the mid-20th century as the city remained a small, railroad-and-mill town of fewer than 5,000 people.
Modern era (post-1965)
The post-1965 period brought two major demographic shifts to Cayce. First, the Immigration and Nationality Act of 1965 had a minimal direct effect here—unlike larger cities, Cayce saw almost no new immigration from Asia or Latin America until the 1990s. Instead, the city’s growth came from domestic in-migration: white families leaving the rural Deep South for Columbia-area jobs, and Black families moving from nearby counties like Orangeburg and Calhoun as part of the broader Great Migration’s tail end. These Black newcomers concentrated in the Pinehurst neighborhood, a post-war subdivision of ranch homes and duplexes east of the railroad tracks, which by 1980 was over 80% Black. Meanwhile, white families gravitated toward the Granby Estates subdivision, a 1960s-era development of larger single-family homes near the Congaree River, which remains predominantly white today. The second major shift began in the 1990s, when Hispanic immigrants—primarily from Mexico and Central America—arrived to work in construction, landscaping, and the poultry processing plants in nearby Lexington County. They settled in the Riverview Terrace mobile home park and the older rental stock along Frink Street, creating a small but visible Hispanic corridor. By 2020, the Hispanic share had risen to 9.6%, while the Black share declined slightly from its 2000 peak of 30% to 26.7%. The Asian population (East/Southeast Asian, 1.9%) and Indian population (1.3%) are very recent arrivals, mostly professionals and graduate students drawn to the University of South Carolina in Columbia, who tend to rent in newer apartment complexes like The Reserve at Cayce rather than buying in established neighborhoods.
The future
Cayce’s population is heading toward modest diversification, but not rapid change. The white share (58.0%) is slowly declining as older residents age in place and younger white families choose newer suburbs like Lexington or Chapin. The Hispanic share is likely to continue growing, possibly reaching 12-14% by 2035, driven by both natural increase and continued labor demand in construction and service industries. The Black population appears stable, with no major out-migration or influx, and the Asian and Indian communities will likely remain small (under 3% combined) unless the city attracts a major employer or university satellite campus. The city is not tribalizing into distinct enclaves—neighborhoods like Pinehurst and Granby Estates remain fairly homogeneous by race, but the newer apartment complexes and the Riverview Terrace area are becoming more mixed. The foreign-born share (3.7%) is below the national average and is not expected to rise dramatically, as Cayce lacks the job base or housing stock to attract large immigrant flows. The most significant demographic trend is aging: the median age is 38.5, above the state median, and the city’s school-age population has declined slightly since 2010.
For someone moving to Cayce now, the city offers a stable, slow-growing community where racial and ethnic lines are present but not sharply drawn. The population is becoming slightly more Hispanic and slightly less white, but the pace of change is slow enough that newcomers will find a place that feels much like it did a decade ago—a quiet, affordable suburb with a genuine small-town history, not a melting pot or a boomtown. The key decision for a new resident is which neighborhood aligns with their priorities: historic walkability in the Historic Cayce District, family-oriented subdivisions in Granby Estates, or lower-cost rentals in the Frink Street corridor.
* Values derived from national, state, county, city and local statistics and may differ in a specific area. Last updated: 2026-04-30T02:17:30.000Z
Narrative content on this page is AI-generated and may contain mistakes. Verify any details that matter before acting on them.
ReloMaps may earn a commission from affiliate links at no extra cost to you.