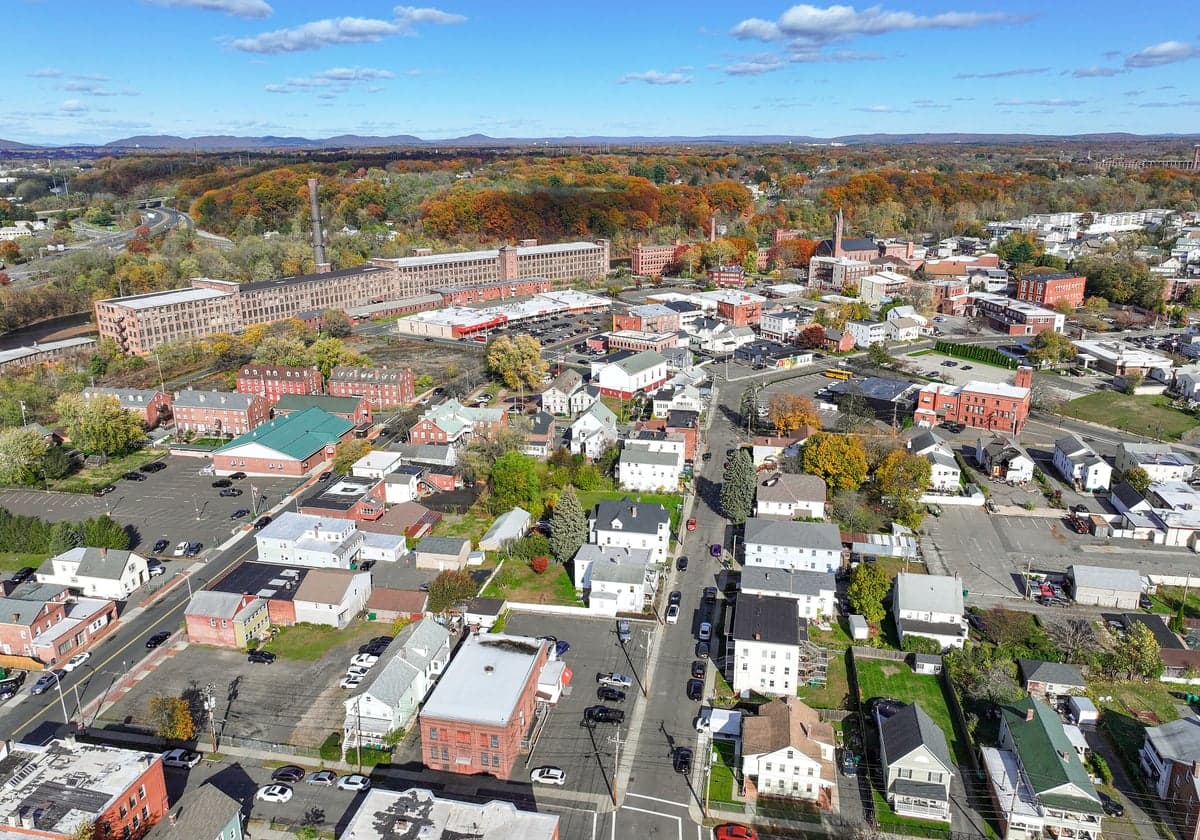
Photo: Wikipedia
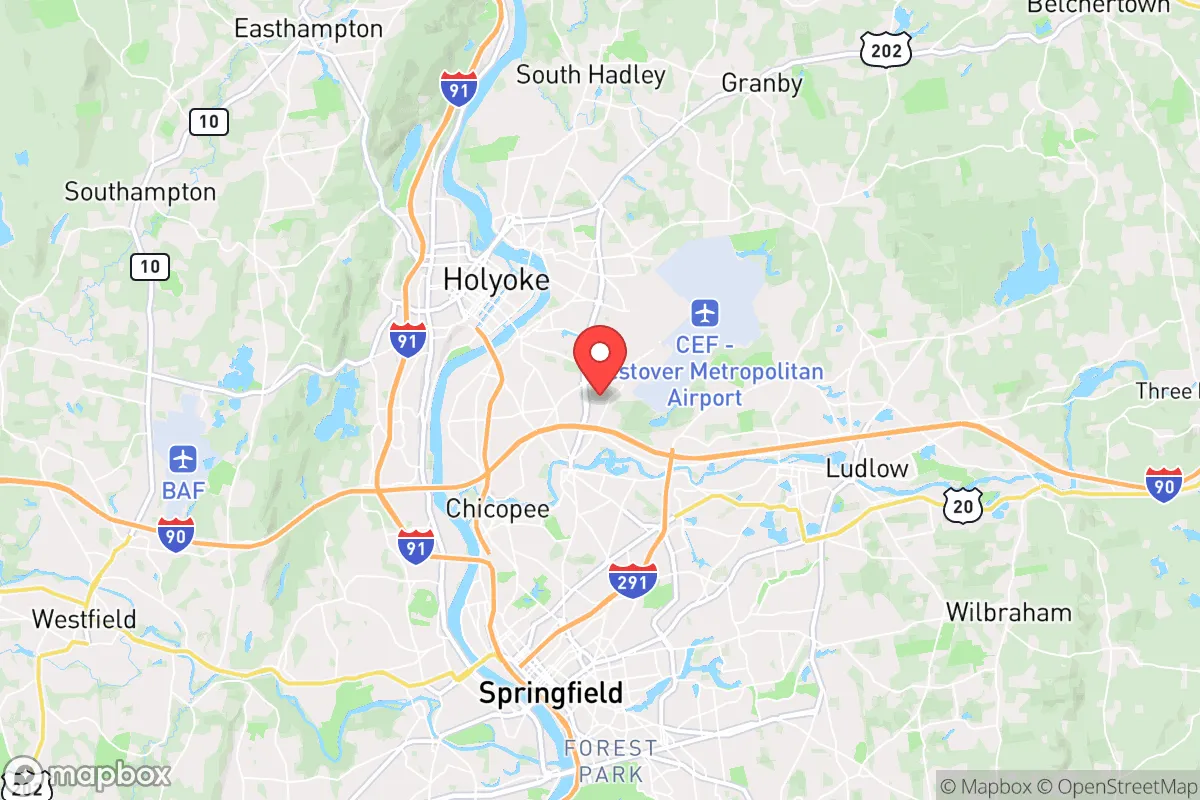
Demographics of Chicopee, MA
Affluence Level in Chicopee, MA
A middle-class area roughly in line with national averages across income, home values, education, and employment.
People of Chicopee, MA
The people of Chicopee, Massachusetts, today form a dense, working-class city of 55,213, marked by a pronounced shift from its historic Franco-American and Polish Catholic roots toward a growing Hispanic majority. With a foreign-born population of just 3.7%, the city is not a traditional immigrant gateway but rather a place where domestic migration and natural increase are reshaping the ethnic landscape. The population is notably less college-educated than the state average at 23.2%, and its identity remains rooted in the mill-town neighborhoods along the Chicopee River, even as newer residents concentrate in the city's southern and eastern wards.
How the city was settled and grew
Chicopee's population history begins with its 1848 incorporation as a separate town from Springfield, driven by the water power of the Chicopee River. The original settlers were Yankee farmers and millwrights, but the real population boom came with the Irish Famine migration of the 1850s and 1860s. Irish laborers built the dams and dug the canals that powered the Ames Sword Company and the Dwight Manufacturing Company, settling in the Chicopee Falls district around the mills. By the 1880s, French Canadians from Quebec arrived in large numbers, drawn by textile and paper mill jobs; they established the Willimansett neighborhood along the river, building St. George's Church as their cultural anchor. A third wave of Polish immigrants arrived between 1890 and 1910, clustering in the Fairview section, where they founded St. Stanislaus Church and a dense network of Polish fraternal organizations. Smaller groups of Italian and Lithuanian immigrants also settled in Chicopee Center (the downtown core), working in the Ames plant and the Stevens Paper Mill. By 1920, the city was overwhelmingly white, Catholic, and working-class, with French and Polish surnames dominating the city directory.
Modern era (post-1965)
The post-1965 period saw the gradual erosion of Chicopee's ethnic enclaves. The 1968 closure of the Ames Sword Company and the decline of paper manufacturing triggered a long economic stagnation, and the children of the Franco-American and Polish families began leaving for the suburbs of East Longmeadow and Wilbraham. Into this vacuum came the first significant Hispanic migration, primarily Puerto Ricans, starting in the 1970s. They settled in the older, cheaper housing stock of Chicopee Falls and the Fairview neighborhoods, areas that had lost their original ethnic populations. The Hispanic share grew slowly through the 1980s and 1990s, then accelerated sharply after 2000. Today, at 25.9% Hispanic, the city's Latino population is overwhelmingly Puerto Rican and Dominican, with a smaller but growing Mexican-origin community. The white population, at 65.8%, is now a statistical majority but a cultural minority in many neighborhoods; the Willimansett district, once the heart of French-Canadian Chicopee, is now roughly half Hispanic. The Black population (4.0%) and East/Southeast Asian population (1.5%) are small but concentrated in the Chicopee Center area, near the bus lines and the senior housing complexes. The Indian-subcontinent population (0.4%) is negligible and largely consists of medical professionals commuting to Springfield's hospitals.
The future
Chicopee's demographic future points toward continued Hispanic growth and white population decline. The city's white population is older and aging in place, while the Hispanic population is younger, with a median age roughly 12 years lower. The foreign-born share (3.7%) is low and not rising rapidly, meaning most Hispanic growth comes from U.S.-born children of Puerto Rican and Dominican families rather than new immigration. The city is not tribalizing into distinct enclaves so much as it is experiencing a gradual ethnic succession: the Fairview and Chicopee Falls neighborhoods are becoming predominantly Hispanic, while Willimansett and Chicopee Center are mixed but trending the same direction. The remaining white population is concentrated in the newer subdivisions of Chicopee's western edge (near the Westover Air Reserve Base) and in the more affluent Burnett Road corridor. Over the next 10-20 years, the city is likely to become majority Hispanic, a transition that has already occurred in the public schools, where Hispanic students make up over 40% of enrollment. This shift will likely accelerate as older white homeowners sell to younger Hispanic families seeking affordable housing within commuting distance of Springfield and Hartford.
For a conservative-leaning individual or family considering relocation, Chicopee offers a genuine working-class city with low housing costs and a strong sense of neighborhood identity, but it is a city in demographic transition. The historic Franco-Polish character that defined Chicopee for a century is fading, replaced by a younger, more Hispanic, and more Democratic-leaning population. The city is becoming a more affordable, less suburban alternative to Springfield, with the same urban challenges of aging infrastructure and a tax base that struggles to keep pace with needs. It is not a place of rapid growth or economic dynamism, but rather a stable, slow-changing city where the next generation of residents will look very different from the last.
* Values derived from national, state, county, city and local statistics and may differ in a specific area. Last updated: 2026-05-01T02:07:01.000Z
Narrative content on this page is AI-generated and may contain mistakes. Verify any details that matter before acting on them.
ReloMaps may earn a commission from affiliate links at no extra cost to you.