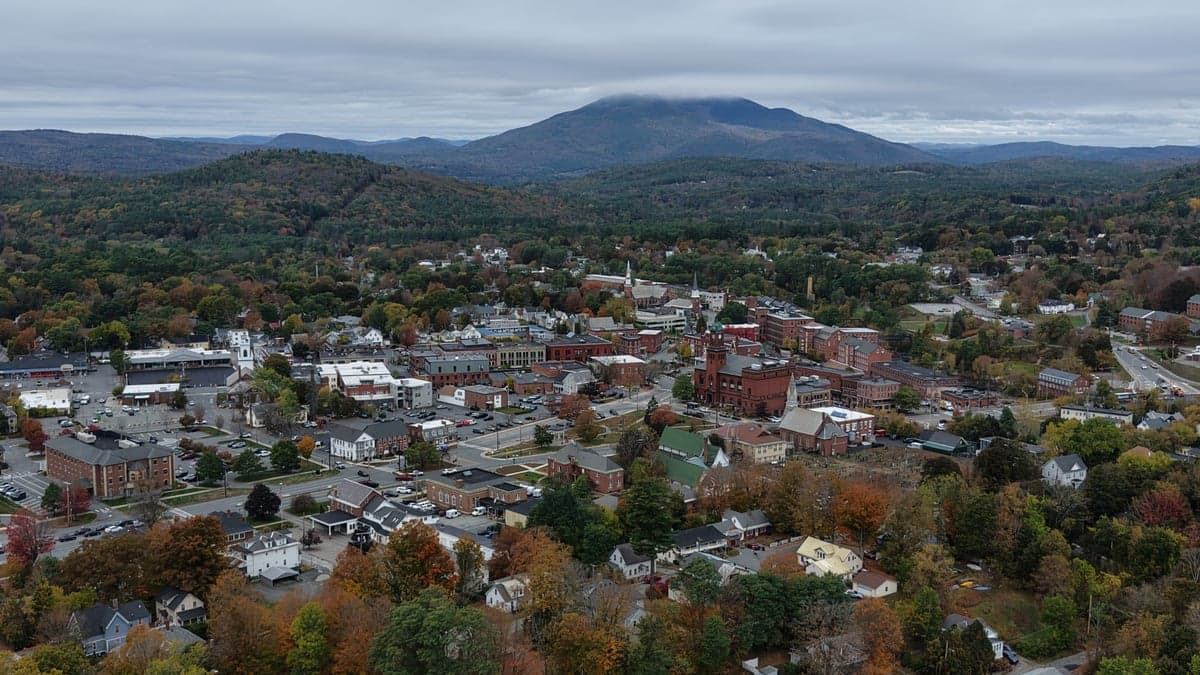
Photo: Wikipedia
Quality of Life in Claremont, NH
A high quality of life with strong walkability, manageable living costs, healthy neighborhood signals, and solid amenity access.
What does Quality of Life tell us?
Quality of Life blends cost of living, nearby amenities, socioeconomic signals, and neighborhood character. City-level scores represent the whole municipality; individual neighborhoods can differ.
What does this tell us?
Quality of Life blends cost of living, nearby amenities, socioeconomic signals, and neighborhood character. City-level scores represent the whole municipality; individual neighborhoods can differ.
Cost of Living
20% below national average
The Real Cost of Living in Claremont, NH for 2026
| Tier | Individual | Family (4) |
|---|---|---|
| Survival | $17k | $32k |
| Comfortable | $33k | $49k |
| Luxury | $98k+ | $153k+ |
| Elite (Top 5%) | $141k+ | $219k+ |
111%
The Area Signal
A metric tracking the socioeconomic signals of the area.


Hobbies
Explore the areaGroceries
1 within 10 miles
Gas
0 within 10 miles
Hospital
3 within 20 miles
Airport
PDX — Portland International Jetport
Post Office
USPS — White River Junction, VT
Critical Amenities
Quality-of-Life Analysis
Claremont, New Hampshire, presents a notably affordable quality of life that attracts a mix of working families, outdoor enthusiasts, and retirees seeking a quieter pace without the premium price tags of southern New Hampshire or the Upper Valley. With a cost of living index of 80—20 percent below the national average—the city offers a tangible financial advantage over nearby Lebanon (index ~110) and Hanover (index ~120), making it a practical choice for those who prioritize space and value over urban amenities. The population of roughly 13,000 is predominantly white-collar and blue-collar, with a median household income around $50,000, reflecting a community where many residents work in manufacturing, healthcare, and retail sectors within Sullivan County.
Cost of living, housing affordability, and how Claremont compares to nearby towns
Claremont’s housing market is among the most accessible in the region. The median home value sits at $171,900, roughly half the median in Lebanon ($350,000+) and about one-third of Hanover’s ($500,000+). Median rent is $1,077, well below the state average of $1,400, making it feasible for single-income households and entry-level workers. Property taxes in Claremont are relatively high—around $28 per $1,000 of assessed value—but the low purchase price keeps monthly carrying costs manageable. The average commute of 22 minutes is shorter than the national average (26 minutes), and many residents drive to larger employers in Lebanon (20 minutes north) or Springfield, Vermont (15 minutes west). For comparison, a similar home in Keene (30 miles south) would cost roughly $250,000, reinforcing Claremont’s position as a budget-friendly base for the region.
Local amenities, schools, and what daily life feels like in Claremont
Daily life in Claremont centers on the downtown area along the Sugar River, with a mix of independent shops, diners, and the Claremont Opera House hosting live performances. The Claremont School District serves about 2,000 students across four elementary schools, a middle school, and Stevens High School, which offers a career and technical education center popular among trades-bound students. For outdoor recreation, the Northern Rail Trail runs 38 miles through town, connecting to Lebanon and Mascoma Lake, while Arrowhead Recreation Area provides skiing and tubing in winter. Groceries and errands are handled at Hannaford and Market Basket, with larger retail options in Lebanon (20 minutes away). The city lacks a major hospital—most residents use Valley Regional Hospital in Claremont for urgent care or Dartmouth-Hitchcock Medical Center in Lebanon for specialized services. The rhythm is slow and neighborly, with community events like the Claremont Farmers Market and the Fall Festival drawing consistent local turnout.
Claremont is best suited for budget-conscious buyers, remote workers, and retirees who value low housing costs and outdoor access over nightlife or high-end dining. Families with school-age children may find the district adequate but should research specific programs, while young professionals will likely need to commute to Lebanon or Hanover for career growth. The city’s affordability and short commute make it a practical anchor for those who prioritize financial breathing room and a relaxed, small-town lifestyle in the Upper Connecticut River Valley.
Crime in Claremont, NH
Lower crime rates than 75% of comparable U.S. locations.
Violent CrimeViolent Crime Analysis
Property CrimeProperty Crime Analysis
Crime Analysis
Claremont, New Hampshire, presents a mixed safety profile for potential residents. The city’s violent crime rate of 182.6 incidents per 100,000 people is notably lower than the national average, but its property crime rate of 1,818.5 per 100,000 exceeds both state and national benchmarks. This combination means that while violent confrontations are relatively rare, residents face a heightened risk of theft, burglary, and vandalism compared to the rest of New Hampshire.
Crime in context
When compared to the broader state of New Hampshire—which consistently ranks among the safest states in the U.S.—Claremont’s property crime rate stands out as a significant outlier. The state’s average property crime rate hovers around 1,100 per 100,000, meaning Claremont’s rate is roughly 65% higher. Violent crime, however, is a different story: at 182.6 per 100,000, it is well below the national average of approximately 380 per 100,000 and only slightly above the New Hampshire state average of about 170 per 100,000. This suggests that Claremont is not a high-violence community, but property-related offenses are a persistent concern. The city’s location near the larger metro area of Lebanon-Hanover and its proximity to the Vermont border may contribute to transient crime patterns, though specific data on cross-border activity is limited.
What residents experience
Daily life in Claremont for most residents involves a heightened awareness of property security. Car break-ins, package thefts, and residential burglaries are the most commonly reported incidents, often concentrated in areas with higher rental density and near the downtown commercial corridor. The city’s police department has responded with targeted patrols and community watch programs, but the property crime rate has remained stubbornly high. For families and retirees, this means that securing homes with alarms, cameras, and good lighting is a practical necessity rather than an optional precaution. Violent crime, while rare, does occur—typically in the form of assaults and domestic incidents—and is not a random street threat for most residents. However, the presence of a progressive judicial philosophy in Sullivan County, where Claremont is located, is a factor worth noting. Liberal-leaning district attorneys and judges in the region have been associated with lenient sentencing and reduced pretrial detention, which critics argue leads to more repeat property offenders cycling back onto the streets. This ideological approach, while intended to reduce incarceration, can directly undermine public safety by failing to deter chronic criminals.
Neighborhood-level variation in Claremont is noticeable. The more affluent areas on the city’s outskirts, such as along Maple Avenue and near the Sugar River, experience lower crime rates than the central downtown zone and the multi-family housing clusters near the former industrial sites. The Claremont Housing Authority properties and the area around Opera House Square have historically reported higher incident numbers. For those considering a move, consulting the Claremont Police Department’s publicly available crime maps and speaking with local real estate agents about block-by-block conditions is strongly advised. Overall, Claremont is a community where vigilance is rewarded, and where the property crime challenge is amplified by a justice system that prioritizes offender rehabilitation over public protection.
* Values derived from national, state, county, city and local statistics and may differ in a specific area. Last updated: 2026-04-19T05:08:20.000Z
Narrative content on this page is AI-generated and may contain mistakes. Verify any details that matter before acting on them.
ReloMaps may earn a commission from affiliate links at no extra cost to you.