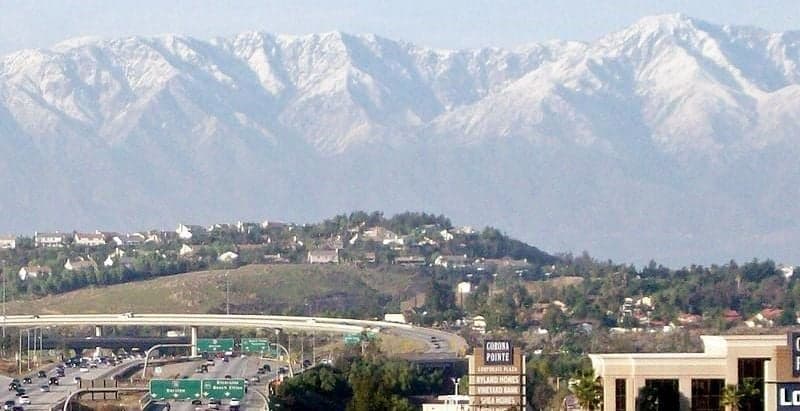
Photo: Wikipedia
Quality of Life in Corona, CA
A high quality of life with strong walkability, manageable living costs, healthy neighborhood signals, and solid amenity access.
What does Quality of Life tell us?
Quality of Life blends cost of living, nearby amenities, socioeconomic signals, and neighborhood character. City-level scores represent the whole municipality; individual neighborhoods can differ.
What does this tell us?
Quality of Life blends cost of living, nearby amenities, socioeconomic signals, and neighborhood character. City-level scores represent the whole municipality; individual neighborhoods can differ.
Cost of Living
103% above national average
The Real Cost of Living in Corona, CA for 2026
| Tier | Individual | Family (4) |
|---|---|---|
| Survival | $34k | $64k |
| Comfortable | $111k | $163k |
| Luxury | $162k+ | $252k+ |
| Elite (Top 5%) | $191k+ | $296k+ |
65%
The Area Signal
A metric tracking the socioeconomic signals of the area.
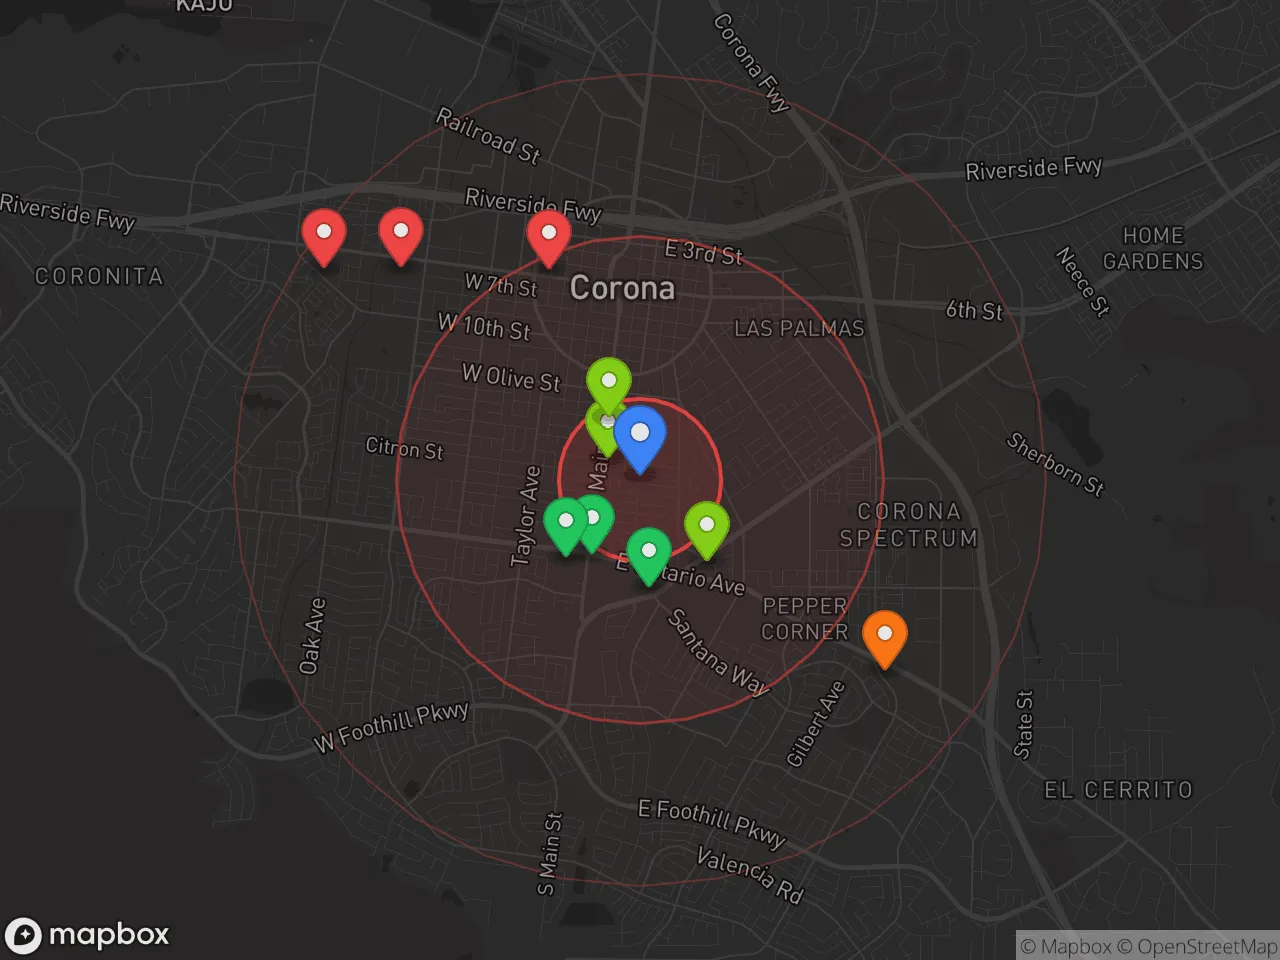
Hobbies
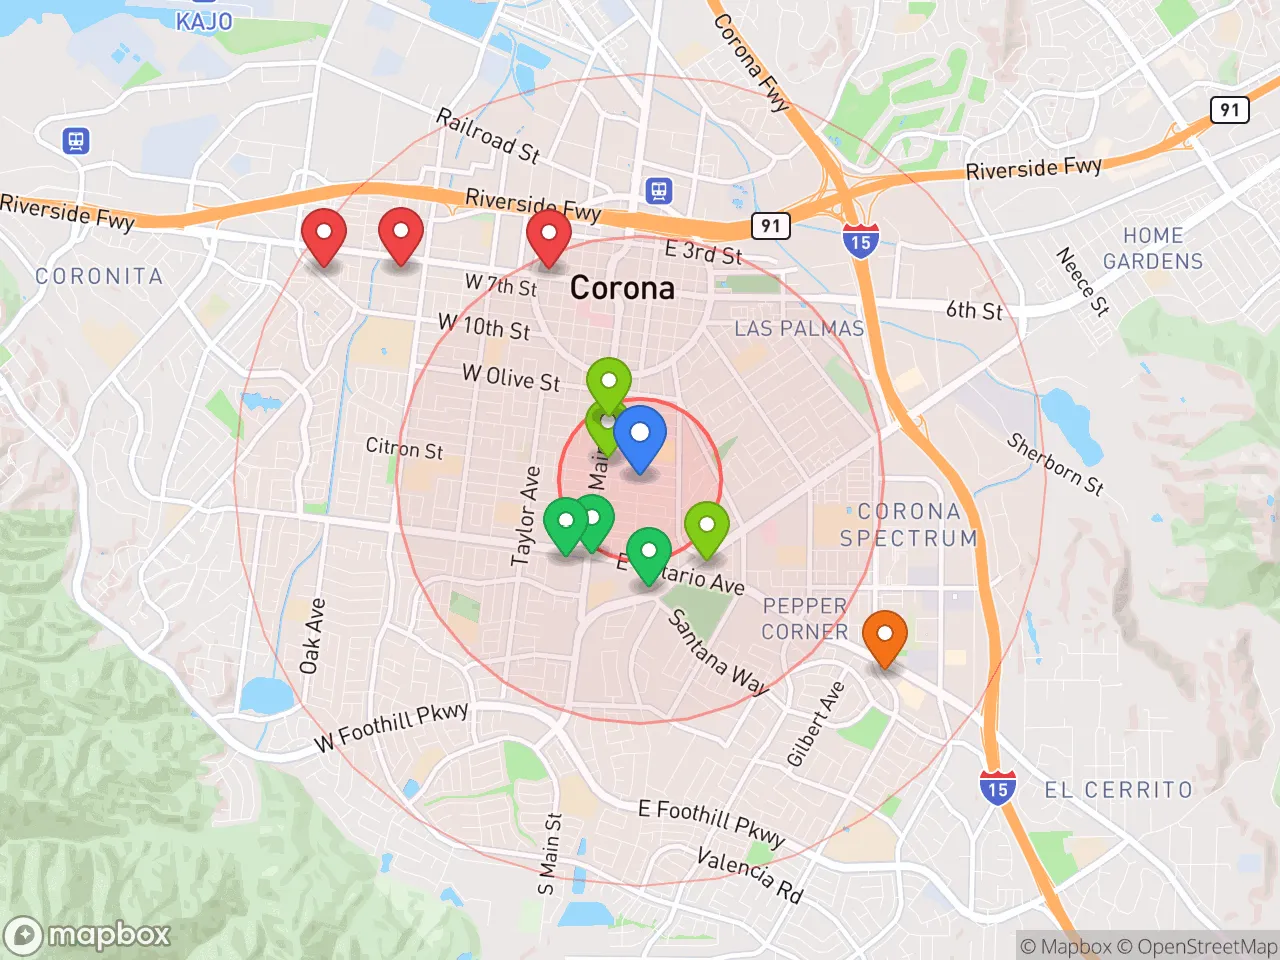
Explore the areaGroceries
0 within 10 miles
Gas
0 within 10 miles
Hospital
0 within 20 miles
Airport
SAN — San Bernardino International
Post Office
Critical Amenities
Quality-of-Life Analysis
Corona, California, presents a quality of life defined by its position as an affluent, family-oriented suburb within the Inland Empire, attracting a demographic of professionals and commuters who trade a higher cost of living for access to top-tier schools and a relatively safer environment compared to neighboring cities. With a cost of living index of 203—more than double the national average—the city draws residents who prioritize space, newer housing stock, and a suburban lifestyle over the urban density of Los Angeles or Orange County. The population skews toward married couples with children, reflecting a community built around school districts, parks, and master-planned neighborhoods like the gated communities of Dos Lagos.
Cost of living and housing affordability compared to Orange County and Los Angeles
Corona’s cost of living is steep by national standards but offers a measurable affordability advantage over coastal counties. The median home value sits at $656,500, which is roughly 30% lower than the median in Orange County (around $950,000) and 20% below Los Angeles County’s median. Median rent is $2,136, a figure that undercuts comparable rentals in Irvine or Santa Ana by $500–$800 per month. However, this relative affordability comes with a trade-off: the average commute time is 35 minutes, reflecting the reality that many residents drive west to jobs in Anaheim, Santa Ana, or Los Angeles. For buyers, the housing stock is dominated by single-family homes built between the 1980s and 2000s, with newer developments in the north near the 91 freeway. Property taxes are capped at roughly 1.1% of assessed value under Proposition 13, but total monthly housing costs—including HOA fees in planned communities—can push a mortgage payment well above $3,500.
Schools, parks, and the daily rhythm of family life
Daily life in Corona revolves around its highly rated public schools, particularly those in the Corona-Norco Unified School District, which includes Centennial High School and Santiago High School—both consistently ranked among the top 10% of California high schools. The city operates over 30 parks, with the Santa Ana River Trail providing a 30-mile paved path for cycling and running that connects to Riverside. The Fender Center and the Corona Civic Center host community events, while the Dos Lagos shopping center offers an outdoor mall with dining and a movie theater. Traffic congestion is a daily reality, especially along the 91 freeway, where express lanes cost variable tolls; many residents adjust their schedules to leave before 6:30 a.m. or after 9:00 a.m. to avoid peak delays. Grocery costs are roughly 15% above the national average, but the presence of ethnic markets and farmers’ markets (like the one at Corona City Hall on Saturdays) helps offset some expenses.
Corona is best suited for families and professionals who value strong schools, low crime rates, and a suburban environment over urban nightlife or walkability. The city’s violent crime rate is roughly 40% below the national average, and its property crime rate is lower than nearby Riverside or San Bernardino. Commuters willing to endure the 35-minute average drive—or longer during peak hours—will find a stable housing market with good long-term appreciation potential. Empty nesters and retirees may prefer quieter inland communities like Temecula, but for those raising children or seeking a safe, amenity-rich base within striking distance of Southern California’s job centers, Corona offers a compelling balance of cost, space, and community infrastructure.
Crime in Corona, CA
Crime rates similar to the national median for U.S. locations.
Violent CrimeViolent Crime Analysis
Property CrimeProperty Crime Analysis
Crime Analysis
Corona, California, presents a mixed safety profile that demands careful consideration from potential residents. While the city's violent crime rate of 238 incidents per 100,000 people sits below the national average, its property crime rate of 1,582.4 per 100,000 is significantly elevated, reflecting challenges common to large metro areas in Southern California. The broader regional context—including progressive district attorneys and judicial policies in nearby counties—creates an environment where property crime and recidivism remain persistent concerns for residents and local businesses.
Crime in context
Corona's violent crime rate of 238 per 100,000 is roughly 32% lower than the national average of about 380 per 100,000, and well below the California state average of approximately 442 per 100,000. This positions Corona as relatively safer for violent offenses compared to many peer cities in the Inland Empire. However, the property crime rate of 1,582.4 per 100,000 is nearly 20% higher than the national average of roughly 1,320 per 100,000. This disparity is typical for cities within commuting distance of Los Angeles and Orange County, where high population density and proximity to larger urban centers drive elevated theft, burglary, and vehicle crime rates. The influence of progressive criminal justice reforms in California—including reduced sentencing for certain non-violent felonies and lower bail requirements—has been cited by local law enforcement as a factor in repeat property offenses.
What residents experience
Daily life in Corona involves navigating a tangible property crime risk. Auto theft and break-ins, particularly in shopping centers along the 91 freeway corridor and in neighborhoods near the Crossings at Corona, are common complaints. Residents often report package theft and garage burglaries in newer subdivisions. Violent crime is more concentrated, with gang-related incidents and aggravated assaults occurring primarily in specific areas like the west side near the Santa Ana River corridor. The city's police department maintains a visible presence, but response times can lag during peak hours due to the city's 170,000+ population and its role as a regional transit hub. Neighborhood-level variation is stark: gated communities in the hills above Green River Road and the Dos Lagos area report far lower incident rates than older, denser neighborhoods near Main Street and Ontario Avenue. Prospective renters and buyers should consult the Corona Police Department's online crime map and consider that progressive judicial policies in Riverside County have led to shorter sentences for property offenders, a pattern that directly impacts quality of life through repeat victimization in affected blocks.
* Values derived from national, state, county, city and local statistics and may differ in a specific area. Last updated: 2026-04-24T13:29:41.000Z
Narrative content on this page is AI-generated and may contain mistakes. Verify any details that matter before acting on them.
ReloMaps may earn a commission from affiliate links at no extra cost to you.