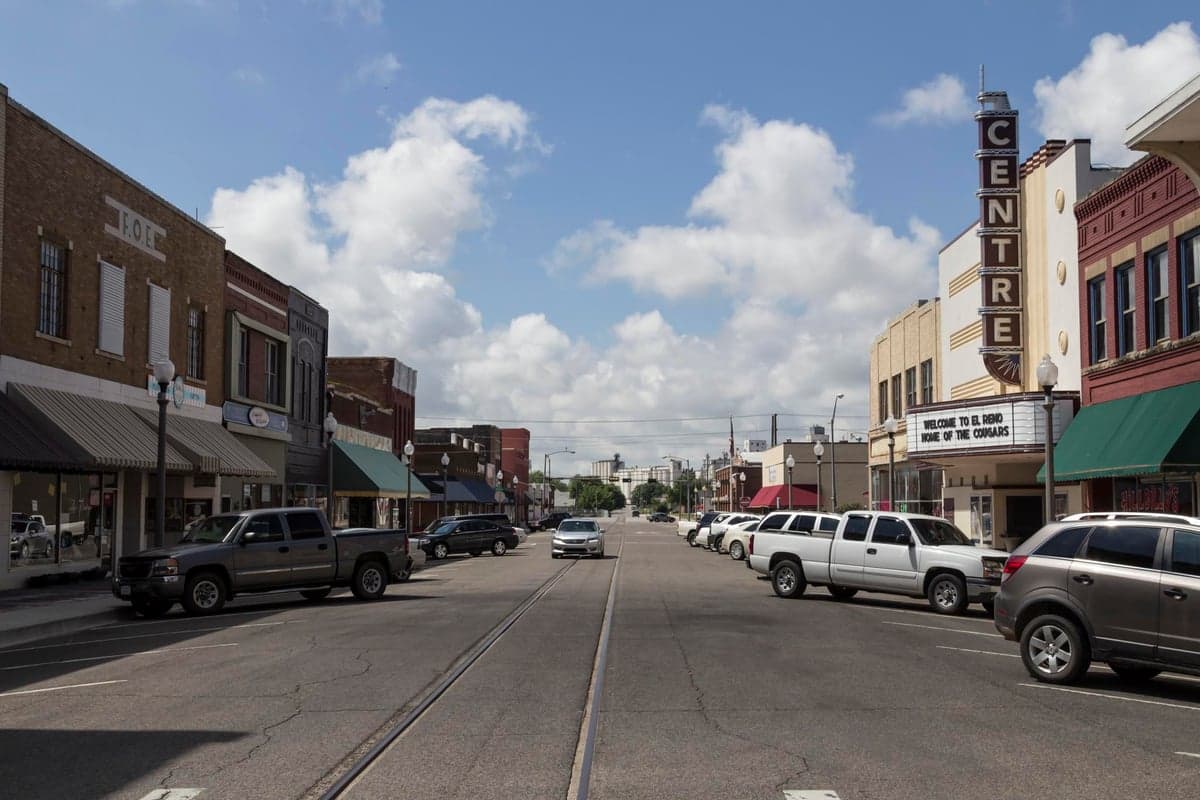

Photo: Wikipedia
Quality of Life in El Reno, OK
A high quality of life with strong walkability, manageable living costs, healthy neighborhood signals, and solid amenity access.
What does Quality of Life tell us?
Quality of Life blends cost of living, nearby amenities, socioeconomic signals, and neighborhood character. City-level scores represent the whole municipality; individual neighborhoods can differ.
What does this tell us?
Quality of Life blends cost of living, nearby amenities, socioeconomic signals, and neighborhood character. City-level scores represent the whole municipality; individual neighborhoods can differ.
Cost of Living
31% below national average
The Real Cost of Living in El Reno, OK for 2026
| Tier | Individual | Family (4) |
|---|---|---|
| Survival | $14k | $27k |
| Comfortable | $31k | $45k |
| Luxury | $90k+ | $140k+ |
| Elite (Top 5%) | $106k+ | $164k+ |
121%
The Area Signal
A metric tracking the socioeconomic signals of the area.

Hobbies
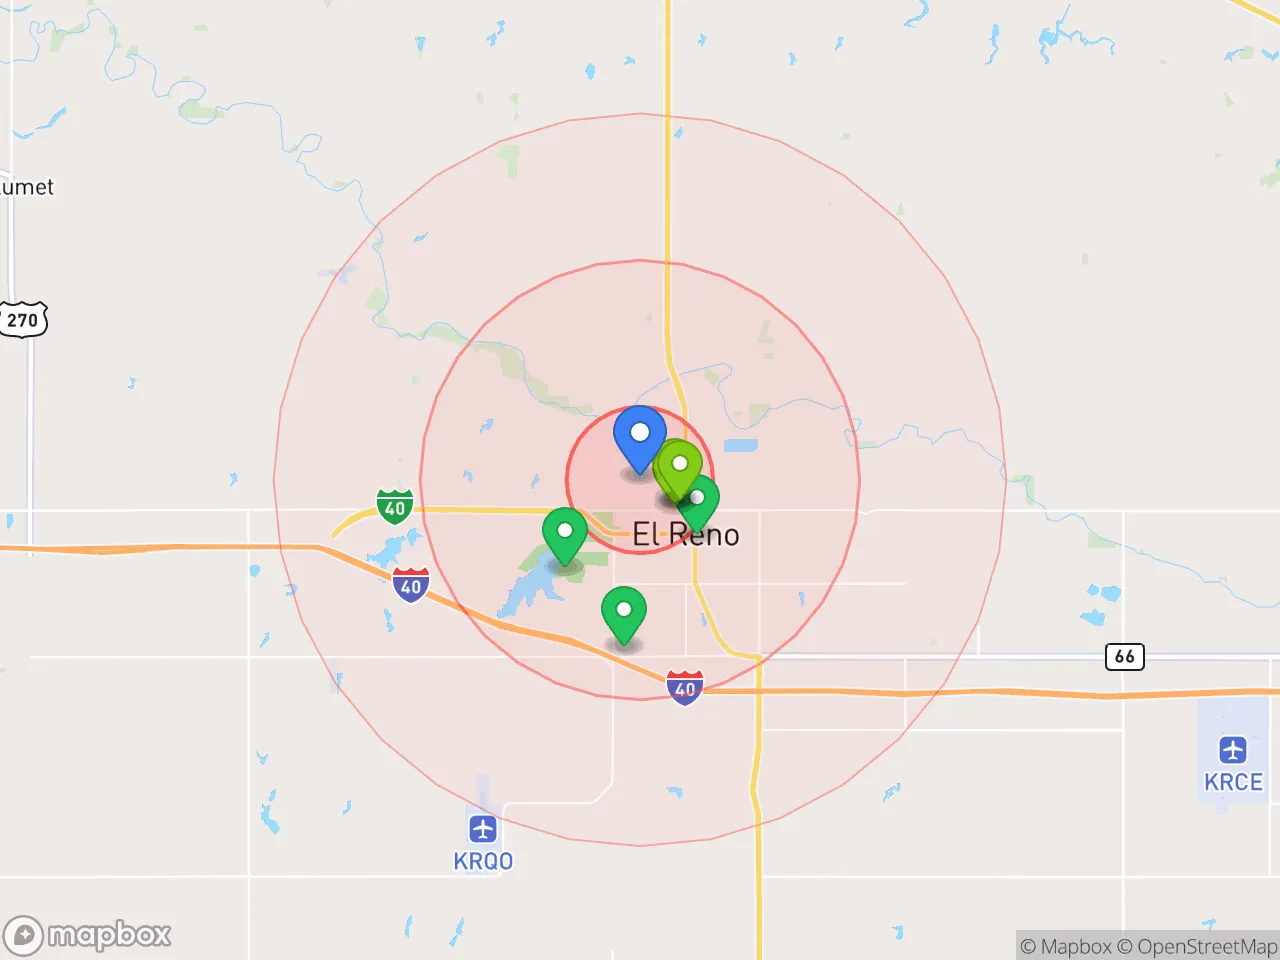
Explore the areaGroceries
1 within 10 miles
Gas
8 within 10 miles
Hospital
7 within 20 miles
Airport
DFW — Dallas/Fort Worth International
Post Office
USPS — El Reno, OK
Critical Amenities
Quality-of-Life Analysis
El Reno, Oklahoma, offers a notably affordable quality of life that attracts a mix of working-class families, retirees, and commuters seeking a slower pace within reach of Oklahoma City. With a cost-of-living index of 69—31% below the national average—the city provides a financial cushion that allows residents to stretch their incomes further than in most U.S. metro areas. The population skews toward middle-income households and blue-collar workers, many employed in local manufacturing, agriculture, or the nearby Tinker Air Force Base, giving the community a grounded, self-reliant character.
How housing costs and daily expenses compare to Oklahoma City and Yukon
El Reno’s housing market is a primary draw for budget-conscious movers. The median home value sits at $157,000, roughly half the national median and significantly below the Oklahoma City metro average of about $220,000. Renters also benefit: the median rent of $904 undercuts nearby Yukon’s typical $1,100 and Oklahoma City’s $1,050. Utility costs and grocery prices align with the low COL index, keeping monthly outlays manageable. The average commute of 22.4 minutes is slightly longer than the national average of 26 minutes, but many residents drive east to jobs in Oklahoma City or Midwest City, a 30- to 40-minute trip on Interstate 40. This commute trade-off—longer than living in the city core but far shorter than exurban sprawl—makes El Reno a practical compromise for workers who want lower housing costs without a punishing drive.
What daily life is like for families: schools, parks, and local amenities
Daily life in El Reno revolves around a compact downtown with historic brick storefronts, a handful of locally owned restaurants, and the annual Fried Onion Burger Day festival, which draws thousands. The El Reno Public School district serves most families, with three elementary schools, one middle school, and El Reno High School (enrollment ~800). The district’s graduation rate hovers near 85%, slightly below the state average, but class sizes remain small. For recreation, Lake El Reno offers fishing and walking trails, while the city’s six parks provide playgrounds and sports fields. Residents drive 10 minutes to Yukon for larger retail chains or 30 minutes to Oklahoma City for major medical centers, entertainment, and the Will Rogers World Airport. The rhythm is quiet—most businesses close by 9 p.m.—and community events like the weekly farmers market (May–October) anchor social life.
El Reno suits those who prioritize affordability and a low-key lifestyle over urban amenities or high-end dining. It works well for first-time homebuyers, retirees on fixed incomes, and commuters who tolerate a moderate drive for cheaper housing. Families with school-age children will find adequate but not exceptional schools, while singles or young professionals may feel limited by the small-town social scene. For anyone seeking a financially stable, unhurried base within an hour of a major city, El Reno delivers a practical, grounded option.
Crime in El Reno, OK
Lower crime rates than 77% of comparable U.S. locations.
Violent CrimeViolent Crime Analysis
Property CrimeProperty Crime Analysis
Crime Analysis
El Reno, Oklahoma, reports a violent crime rate of 196.7 incidents per 100,000 residents, a figure that sits below the national average but warrants attention due to its property crime rate of 1,089.1 per 100,000, which is notably higher than both state and national benchmarks. The city’s overall safety picture is shaped by its position as a small city near the Oklahoma City metro area, where the influence of progressive judicial policies in the broader region can contribute to higher recidivism and reduced public confidence in the justice system. For residents and those considering relocation, understanding these numbers in context is essential for making an informed decision about personal and family safety.
Crime in context
El Reno’s violent crime rate of 196.7 per 100,000 is approximately 44% lower than the national average of roughly 380 per 100,000, placing it in a relatively safer bracket for serious offenses like homicide, assault, and robbery. However, the property crime rate of 1,089.1 per 100,000 is about 30% higher than the national average of roughly 840 per 100,000, and significantly exceeds the Oklahoma state average of approximately 950 per 100,000. This disparity suggests that while violent confrontations are less common, theft, burglary, and vehicle break-ins are persistent concerns. The proximity to a large metro area like Oklahoma City, which has seen debates over progressive district attorney policies that emphasize diversion and reduced sentencing, may contribute to property crime spillover as offenders face fewer consequences for non-violent offenses.
What residents experience
Daily life in El Reno involves a heightened awareness of property crime, with residents reporting that unlocked vehicles and unattended outdoor items are frequent targets. The city’s historic downtown and residential neighborhoods near U.S. Route 66 see periodic thefts, while violent crime remains rare but not absent—typically tied to domestic disputes or isolated incidents rather than random attacks. Local law enforcement maintains a visible presence, but the broader judicial environment in Canadian County and the Oklahoma City metro area can undermine deterrence. Progressive justice reforms, including bail reform and early release programs, have been linked to increased property crime cycles in surrounding communities, as offenders cycle through the system without meaningful accountability. Families and retirees often cite the need for home security systems and neighborhood watch participation as practical necessities.
Neighborhood-level variation in El Reno is moderate, with areas closer to the city center and major highways experiencing higher property crime rates than outlying residential subdivisions. The area around the El Reno Federal Correctional Institution, while not a direct source of local crime, adds a layer of concern for some residents. Newer developments on the city’s north and west edges tend to report fewer incidents, while older neighborhoods near the downtown core and along the railroad corridor see more frequent break-ins. Prospective residents should research specific blocks and consult local police reports, as the city’s overall statistics mask pockets where property crime is more concentrated. The influence of progressive judicial policies in the metro area means that even relatively safe neighborhoods are not immune to the broader trend of leniency-driven recidivism.
* Values derived from national, state, county, city and local statistics and may differ in a specific area. Last updated: 2026-04-25T13:51:37.000Z
Narrative content on this page is AI-generated and may contain mistakes. Verify any details that matter before acting on them.
ReloMaps may earn a commission from affiliate links at no extra cost to you.