Photo: Wikipedia
Demographics of Elgin, IL
Affluence Level in Elgin, IL
A middle-class area roughly in line with national averages across income, home values, education, and employment.
People of Elgin, IL
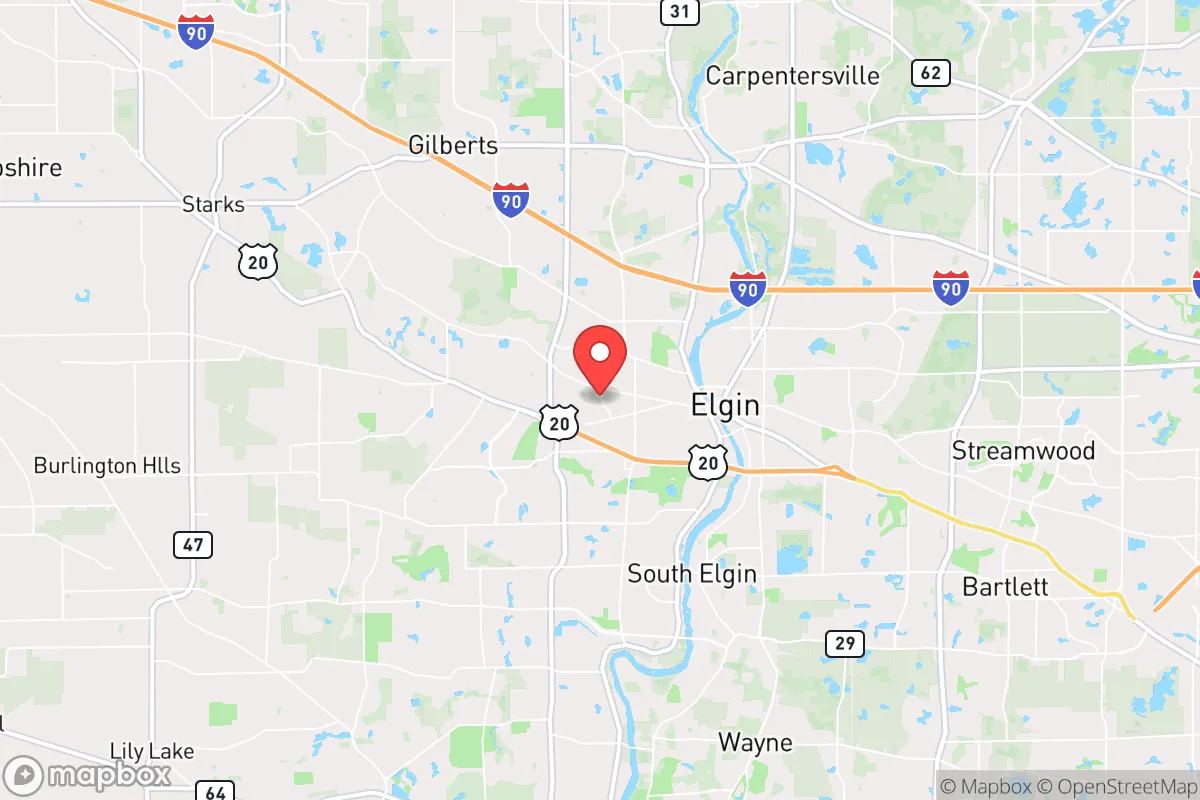
Elgin, Illinois, is a city of 114,106 residents defined by its majority-Hispanic population (48.4%) and a white population that has fallen to 36.3%, making it one of the most demographically transformed midsize cities in the Chicago metropolitan area. With a foreign-born share of 14.5% and a college attainment rate of 26.0%, Elgin is a working-class and middle-class hub where immigrant communities—particularly from Mexico, Central America, and East/Southeast Asia—have reshaped the city’s character over the past half-century. The city’s identity today is a blend of historic Yankee and German roots, a strong Latino cultural presence, and growing East/Southeast Asian and Indian-subcontinent enclaves, creating a dense, polyglot environment that feels distinct from the surrounding Fox Valley suburbs.
How the city was settled and grew
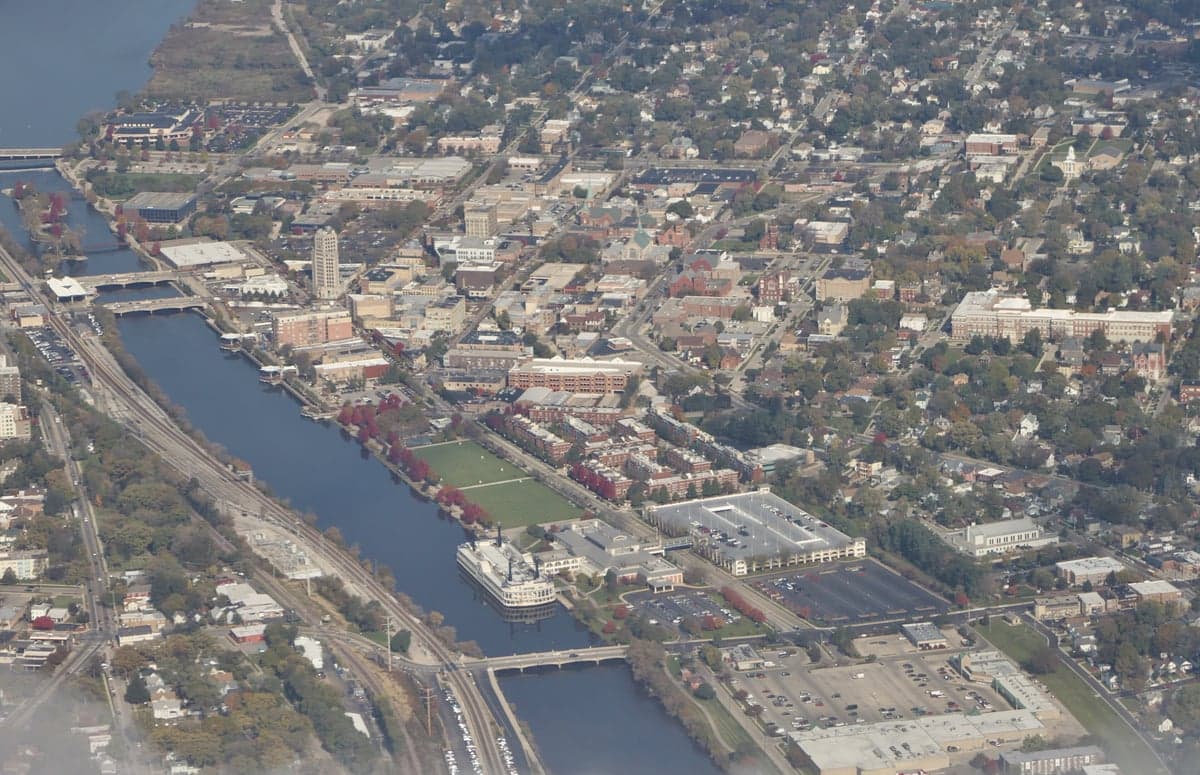
Elgin’s original population was drawn by the Fox River’s waterpower and the arrival of the Galena & Chicago Union Railroad in the 1850s. The city’s first major industry was the Elgin Watch Company, founded in 1864, which attracted skilled Swiss and German watchmakers who settled in the East Side neighborhood, near the factory along the river. These early immigrants built sturdy brick homes and established German-language churches and social clubs that dominated Elgin’s character through the early 1900s. A second wave of Irish and Italian laborers arrived to work in the watch factory and the growing dairy and farm-equipment industries, clustering in the West Side and Bluff City neighborhoods, where modest worker cottages still stand. By 1920, Elgin was a solidly white, Protestant and Catholic city of about 27,000, with a small Black population concentrated near the railroad tracks in the South Grove area. The watch company’s decline after World War II and the opening of the Northwest Tollway (I-90) in the 1950s shifted the economy toward manufacturing and logistics, but the population remained overwhelmingly white—over 95%—until the 1970s.
Modern era (post-1965)
The 1965 Hart-Cellar Act and subsequent waves of immigration transformed Elgin dramatically. Mexican and Central American migrants began arriving in the 1970s and 1980s, drawn by factory jobs at companies like Motorola (which opened a plant in 1974) and later by the construction and service sectors. They settled heavily in the West Side and Lords Park neighborhoods, where Spanish-language storefronts, taquerias, and Catholic parishes like St. Mary’s became anchors. By 2000, the Hispanic share had risen to 33%, and by 2020 it reached 48.4%, making Elgin a majority-minority city. East/Southeast Asian immigrants—primarily Vietnamese, Filipino, and Chinese—arrived in smaller numbers from the 1980s onward, clustering in the Wing Park area and along the Randall Road corridor, where Asian grocery stores and Buddhist temples appeared. Indian-subcontinent families (2.2% of the population) began arriving in the 2000s, drawn by tech and healthcare jobs in the northwest suburbs, and have concentrated in newer subdivisions near Bowes Creek and the I-90 corridor. The Black population, historically small, grew modestly from 3.5% in 2000 to 4.9% today, with many families living in the South Grove and Downtown areas. White flight to exurbs like Hampshire and Huntley accelerated after 1990, leaving the white share at 36.3%—down from 70% in 1990.
The future
Elgin’s population is heading toward further Hispanic majority status, with the white share projected to fall below 30% by 2040 if current trends hold. The Hispanic population is not homogenizing; it is diversifying internally, with newer arrivals from Guatemala, Honduras, and Venezuela joining the established Mexican majority, creating distinct sub-enclaves within the West Side and Lords Park neighborhoods. East/Southeast Asian and Indian communities are growing slowly but steadily, driven by the expansion of healthcare and tech jobs in the Elgin-Geneva corridor, and are likely to remain concentrated in the Bowes Creek and Randall Road areas. The city is tribalizing into distinct ethnic enclaves rather than homogenizing: the West Side is overwhelmingly Hispanic, the East Side retains a white and older demographic, and newer subdivisions are becoming mixed Asian and Indian. The foreign-born share (14.5%) is plateauing as second-generation families assimilate and English proficiency rises, but continued immigration from Latin America and Asia will sustain diversity. The college attainment rate (26.0%) is below the national average, limiting upward mobility for many families, though the city’s affordable housing stock and proximity to Chicago jobs continue to attract new arrivals.
Elgin is becoming a solidly Latino-majority city with significant Asian and Indian minorities, a place where ethnic enclaves are deepening rather than blending. For a conservative-leaning mover, this means a community with strong family and religious institutions—particularly Catholic and evangelical churches—but also one where English is not the dominant language in many neighborhoods, and where public schools face challenges from poverty and language barriers. The city’s future is one of continued demographic change, with the white population shrinking and immigrant communities solidifying their presence, making Elgin a distinctively diverse and working-class anchor of the Fox Valley.
* Values derived from national, state, county, city and local statistics and may differ in a specific area. Last updated: 2026-04-29T19:26:55.000Z
Narrative content on this page is AI-generated and may contain mistakes. Verify any details that matter before acting on them.
ReloMaps may earn a commission from affiliate links at no extra cost to you.