
Quality of Life in Fenwick, CT
A high quality of life with strong walkability, manageable living costs, healthy neighborhood signals, and solid amenity access.
What does Quality of Life tell us?
Quality of Life blends cost of living, nearby amenities, socioeconomic signals, and neighborhood character. City-level scores represent the whole municipality; individual neighborhoods can differ.
What does this tell us?
Quality of Life blends cost of living, nearby amenities, socioeconomic signals, and neighborhood character. City-level scores represent the whole municipality; individual neighborhoods can differ.
Cost of Living
609% above national average
The Real Cost of Living in Fenwick, CT for 2026
| Tier | Individual | Family (4) |
|---|---|---|
| Survival | $44k | $83k |
| Comfortable | $389k | $571k |
| Luxury | $402k+ | $623k+ |
29%
The Area Signal
A metric tracking the socioeconomic signals of the area.
Hobbies
Explore the areaGroceries
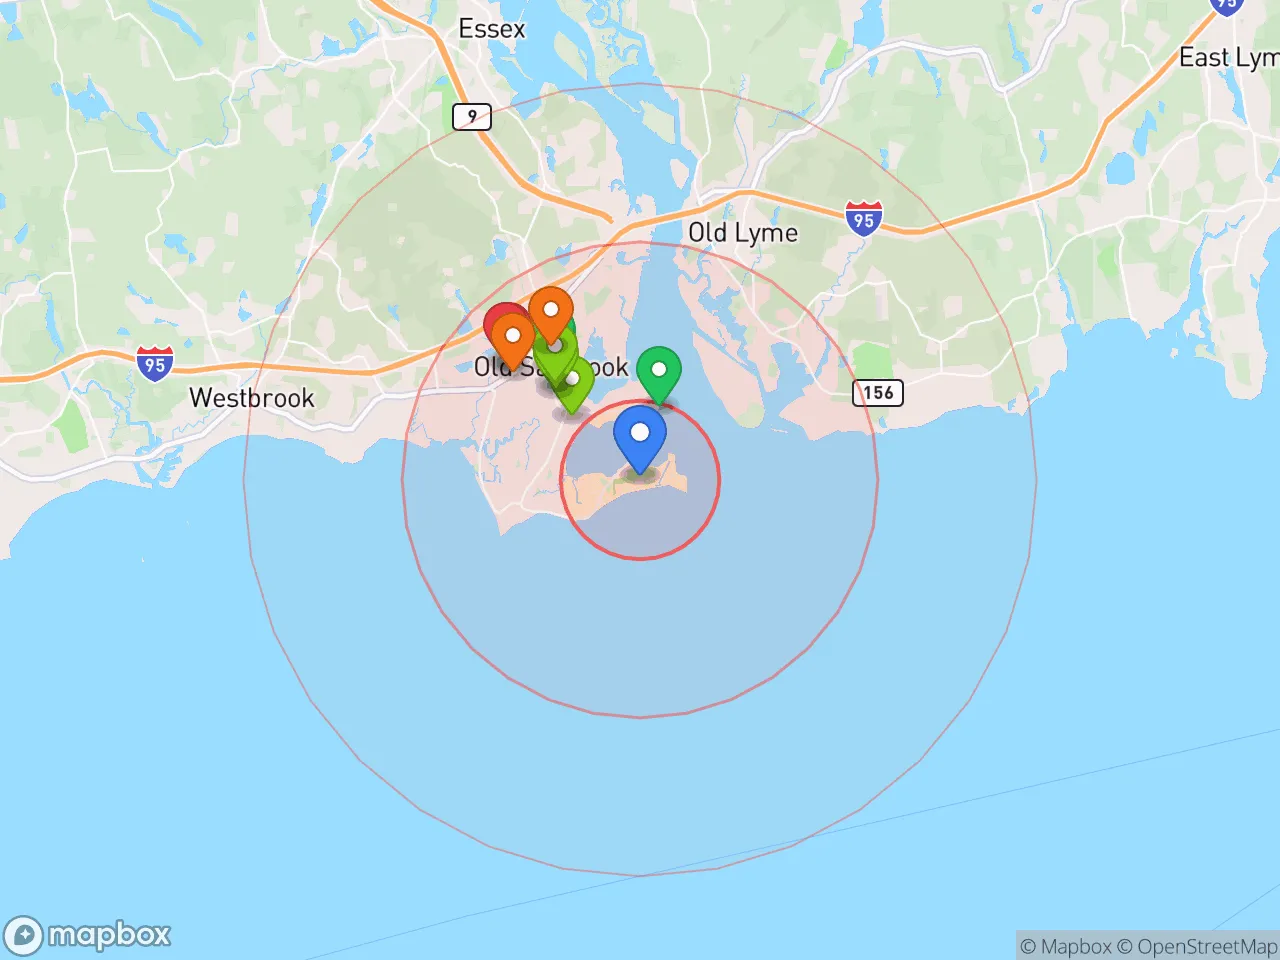
4 within 10 miles
Gas
20 within 10 miles
Hospital
6 within 20 miles
Airport
JFK — John F. Kennedy International
Post Office
USPS — Old Saybrook, CT
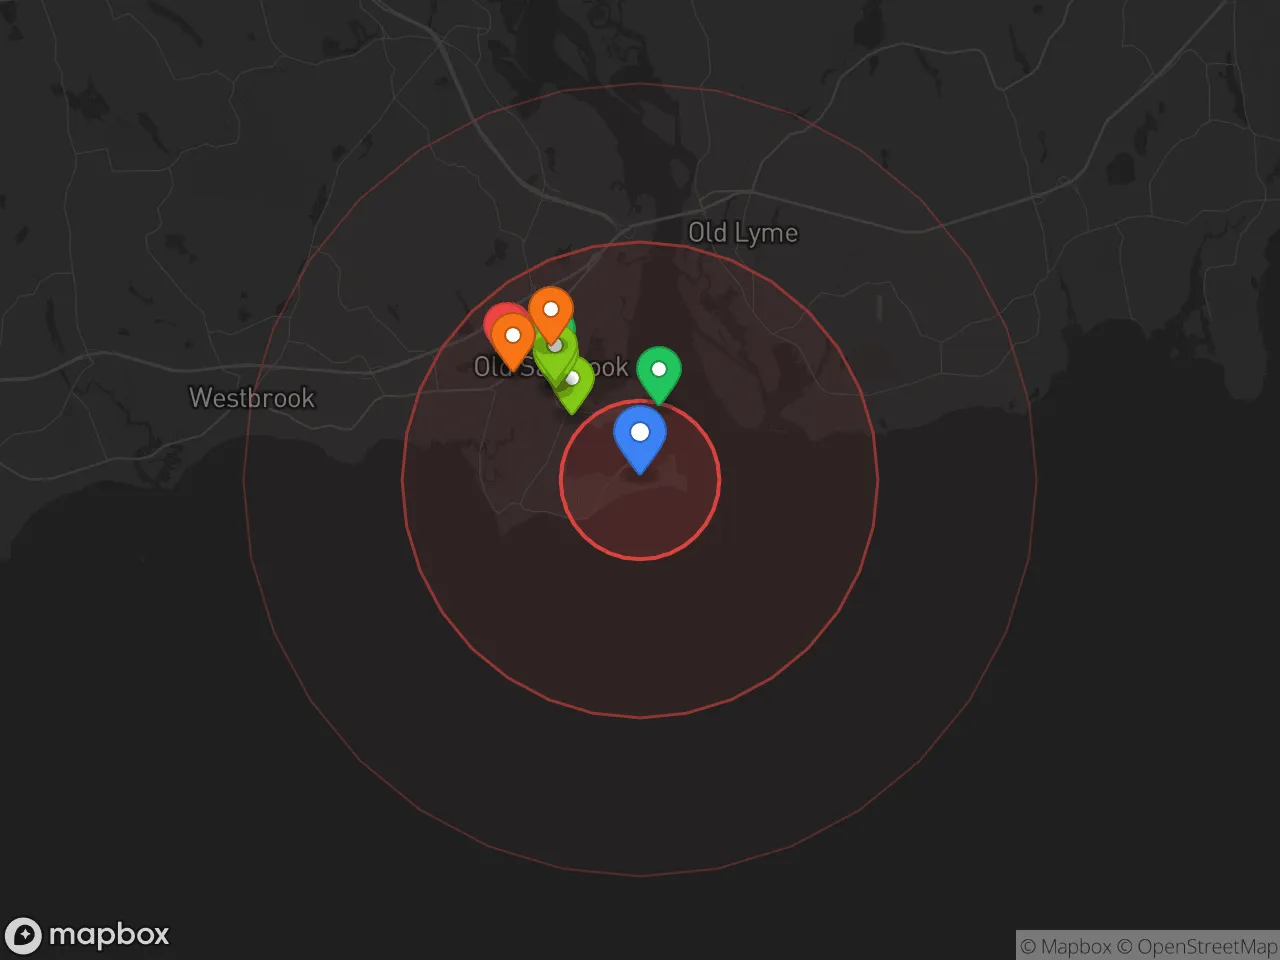
Critical Amenities
Quality-of-Life Analysis
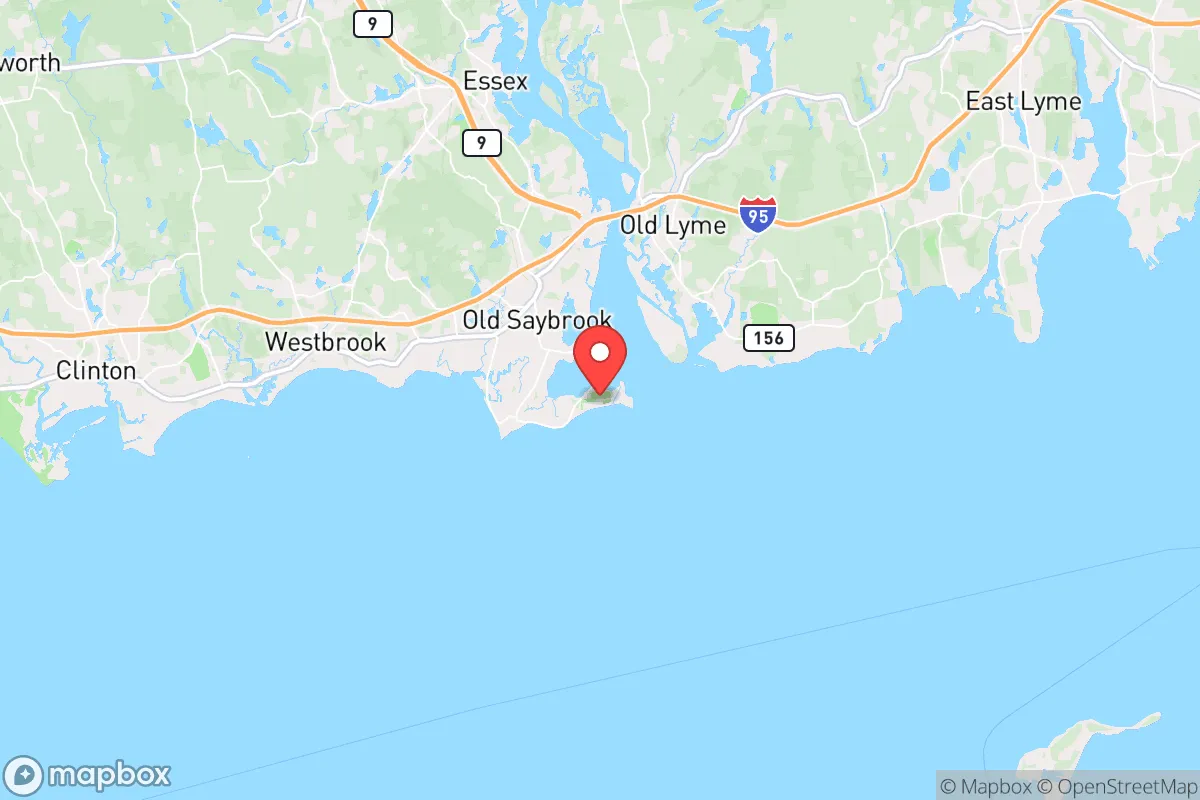
Fenwick, Connecticut, is an ultra-exclusive coastal enclave in Old Saybrook defined by extreme affluence, where the cost of living index of 709 (more than seven times the U.S. average) and a median home value exceeding $2 million signal a community built for high-net-worth individuals seeking privacy, waterfront living, and a tight-knit seasonal atmosphere. The population of roughly 100 year-round residents swells in summer with families who own historic shingle-style homes along the Long Island Sound, creating a rhythm that blends old-money New England tradition with modern luxury. This is not a place for budget-conscious relocators; it is a niche market for those who prioritize exclusivity and direct water access above all else.
Cost of living, housing prices, and how Fenwick compares to nearby coastal towns
Fenwick’s cost of living index of 709 is among the highest in Connecticut, dwarfing nearby Old Saybrook’s index of roughly 130 and even surpassing tony neighbors like Essex (index ~150) and Westbrook (~140). The median home value of $2,000,001 reflects a market where nearly all properties are single-family homes on the Fenwick peninsula, with many lots offering private beaches, docks, and unobstructed views of the Sound. Property taxes in Old Saybrook are moderate for Connecticut (around 2.1% of assessed value), but the sheer price of Fenwick real estate means annual tax bills routinely exceed $40,000. Renting is virtually nonexistent; the few seasonal rentals available in summer command $5,000–$15,000 per week. For context, a comparable waterfront home in nearby Madison or Guilford might cost $1.2–$1.8 million, making Fenwick a premium tier even within the affluent shoreline corridor.
Local amenities, schools, and what daily life feels like in Fenwick
Daily life in Fenwick revolves around the water and the Fenwick Golf Course, a historic 9-hole links-style course that serves as the community’s social hub. The neighborhood has no commercial district—residents drive 5–10 minutes into Old Saybrook’s Main Street for groceries, dining, and services. Old Saybrook Public Schools serve the area, with the district’s high school ranking in the top 20% of Connecticut schools (GreatSchools rating 8/10), though many Fenwick families opt for private day schools like The Williams School in New London or Choate Rosemary Hall in Wallingford. The Fenwick Association, a private homeowners’ group, manages the beach, tennis courts, and community events, fostering a neighborly feel among a population that is overwhelmingly white, older (median age ~55), and politically conservative relative to the rest of Middlesex County. Summer brings a lively social calendar of clambakes, sailing races, and cocktail parties; winter is quiet, with many homes shuttered until Memorial Day.
Fenwick is best suited for wealthy retirees, second-home owners, or remote executives who value absolute waterfront access, privacy, and a low-key social scene over urban amenities or year-round convenience. Families with school-age children may find the isolation and lack of kid-oriented infrastructure limiting, while young professionals would likely feel out of place in a community where the median age hovers near 60. For those who can afford the entry price—and who cherish the idea of owning a piece of Connecticut’s Gilded Age coastline—Fenwick offers a quality of life unmatched in its serenity and exclusivity, but it demands a willingness to pay a steep premium for that privilege.
Crime in Fenwick, CT
Generally safer than 72% of comparable U.S. locations.
Violent CrimeViolent Crime Analysis
Property CrimeProperty Crime Analysis
Crime Analysis
Fenwick, Connecticut, presents a mixed safety profile that demands careful scrutiny from potential residents. While the village's violent crime rate of 107.9 per 100,000 residents is notably lower than the national average, its property crime rate of 1,139.8 per 100,000 is a significant concern, particularly given the area's proximity to larger, more progressive metro areas. The influence of liberal judicial policies in the surrounding region, which often prioritize offender rehabilitation over punitive measures, can create a dynamic where property crimes are treated with less severity, potentially emboldening repeat offenders and undermining public safety.
Crime in context
Fenwick's violent crime rate is roughly 70% lower than the national average, placing it among the safer communities in Connecticut for violent offenses. However, the property crime rate is a different story. At 1,139.8 per 100,000, it is approximately 20% higher than the national average and significantly above the state median for similar-sized villages. This disparity is often linked to the "catch-and-release" policies and reduced sentencing guidelines common in Connecticut's more progressive judicial districts. These policies, while intended to reduce incarceration rates, frequently result in property criminals cycling through the system quickly, returning to the same affluent neighborhoods like Fenwick to commit new offenses. The contrast between low violent crime and elevated property crime is a direct consequence of a justice system that, in the view of many residents, fails to adequately deter theft, burglary, and vandalism.
What residents experience
Daily life in Fenwick for most residents is characterized by a general sense of personal safety, particularly during daylight hours and within the village's tight-knit coastal community. Violent confrontations are rare, and most residents feel comfortable walking alone. The primary safety concern is the persistent threat of property crime, including vehicle break-ins, package thefts, and burglaries of seasonal homes. These incidents are often attributed to transient criminals from nearby cities like Bridgeport and New Haven, where progressive district attorneys have implemented policies that deprioritize prosecution for non-violent property offenses. This creates a frustrating reality where residents invest in security systems and neighborhood watches, yet still experience a steady trickle of thefts, knowing that even if an offender is caught, the likelihood of meaningful legal consequences is low.
Neighborhood-level variation in Fenwick is minimal due to its small size and homogeneous housing stock, but the risk is not uniform. Properties closer to the main road and public beach access points experience higher rates of opportunistic theft, while homes on private, dead-end streets see fewer incidents. The most significant safety variable is seasonal occupancy; vacant summer homes are prime targets during the off-season, with burglars exploiting the lack of year-round surveillance. For those considering a move, the decision hinges on weighing the village's low violent crime against the persistent, policy-driven property crime problem that is a direct byproduct of the region's progressive judicial philosophy.
* Values derived from national, state, county, city and local statistics and may differ in a specific area. Last updated: 2026-04-30T04:12:28.000Z
Narrative content on this page is AI-generated and may contain mistakes. Verify any details that matter before acting on them.
ReloMaps may earn a commission from affiliate links at no extra cost to you.