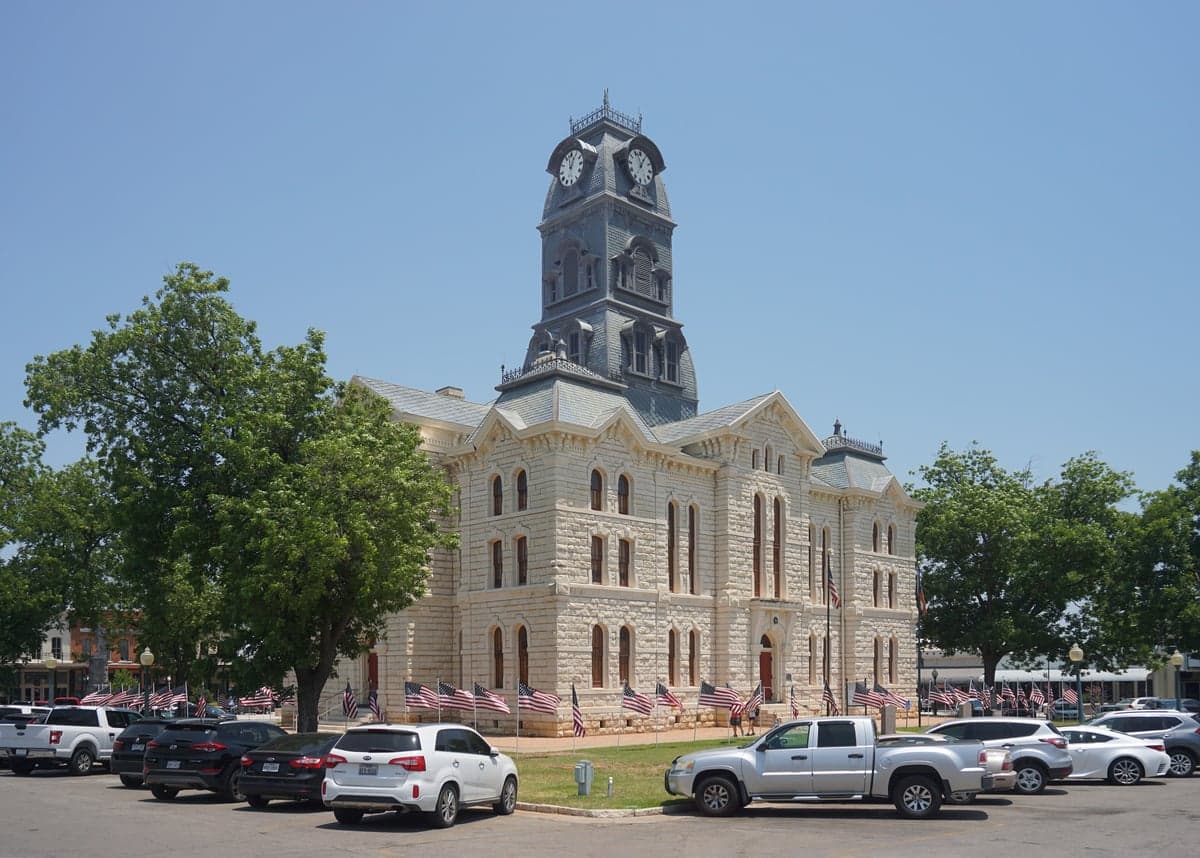
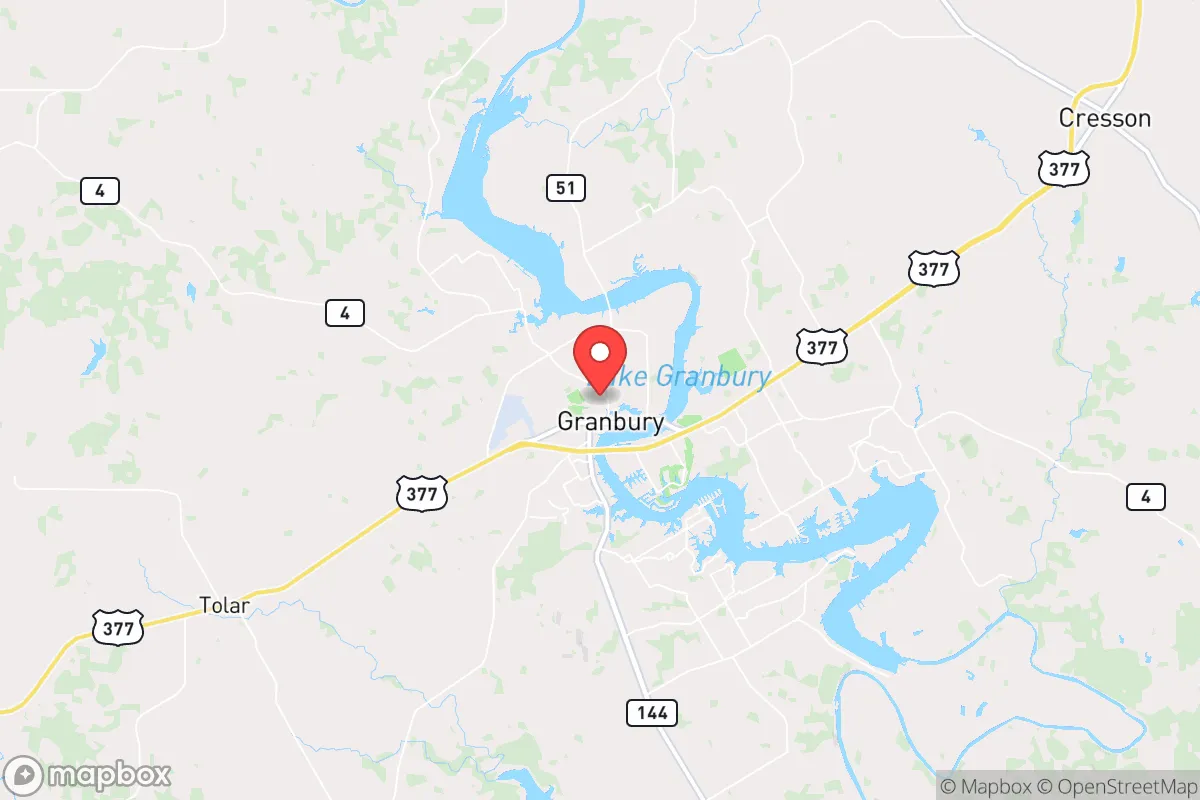
Photo: Wikipedia
Quality of Life in Granbury, TX
A high quality of life with strong walkability, manageable living costs, healthy neighborhood signals, and solid amenity access.
What does Quality of Life tell us?
Quality of Life blends cost of living, nearby amenities, socioeconomic signals, and neighborhood character. City-level scores represent the whole municipality; individual neighborhoods can differ.
What does this tell us?
Quality of Life blends cost of living, nearby amenities, socioeconomic signals, and neighborhood character. City-level scores represent the whole municipality; individual neighborhoods can differ.
Cost of Living
11% above national average
The Real Cost of Living in Granbury, TX for 2026
| Tier | Individual | Family (4) |
|---|---|---|
| Survival | $22k | $42k |
| Comfortable | $54k | $80k |
| Luxury | $124k+ | $193k+ |
| Elite (Top 5%) | $175k+ | $272k+ |
86%
The Area Signal
A metric tracking the socioeconomic signals of the area.


Hobbies
Explore the areaGroceries
5 within 10 miles
Gas
20 within 10 miles
Hospital
2 within 20 miles
Airport
DFW — Dallas/Fort Worth International
Post Office
USPS — Granbury, TX
Critical Amenities
Quality-of-Life Analysis
Granbury, Texas, presents a quality of life defined by its historic square, lakefront setting, and a notably affluent demographic that tilts older and more established than the national average. The city’s cost of living index of 111 (100 = U.S. average) signals a premium over much of rural Texas, yet it remains significantly cheaper than the Dallas-Fort Worth metroplex core, drawing retirees, second-home buyers, and remote workers who value small-town character with proximity to urban amenities. With a median household income well above the state median and a population that is roughly 30% aged 65 or older, Granbury’s social fabric is woven from empty-nesters, lake enthusiasts, and professionals seeking a slower pace without sacrificing access to good schools and healthcare.
Cost of living, housing prices, and how Granbury compares to nearby cities
Granbury’s housing market reflects its desirability: the median home value sits at $278,700, roughly 15% below the national median but notably higher than in neighboring Hood County towns like Tolar or Lipan, where values often fall below $200,000. Median rent of $1,387 is competitive with Fort Worth’s western suburbs but about 10% lower than comparable lakefront communities such as Lakeway or Horseshoe Bay. The overall cost-of-living index of 111 is driven primarily by housing and transportation; groceries and healthcare are near the U.S. average. For context, a household earning $75,000 annually can afford a typical mortgage here, whereas the same income would be stretched thin in Dallas or Austin. Property taxes in Hood County average roughly 1.8% of assessed value, slightly above the Texas median, but there is no state income tax, which offsets some of the burden for higher-income retirees.
What daily life is like: amenities, schools, and local rhythm
Daily life in Granbury revolves around the historic town square, Lake Granbury, and a calendar of community events that includes the annual Granbury Wine Walk and the Fourth of July fireworks over the lake. The Granbury Independent School District is a major draw, with Granbury High School earning a B+ rating from Niche and the district as a whole scoring above the state average in college readiness and STAAR test performance. For families, the presence of Lake Granbury Medical Center (a 73-bed acute-care hospital) and a growing number of specialty clinics means most routine healthcare needs are met locally. The average commute of 28.7 minutes is longer than the national average of 26 minutes, reflecting the many residents who drive to jobs in Fort Worth (about 45 minutes east) or Cleburne. Weekend traffic on U.S. 377 can be heavy, especially during lake season, but the trade-off is a walkable downtown with independent boutiques, a restored opera house, and waterfront parks like the 20-acre Granbury City Park. The pace is distinctly unhurried: restaurants close by 9 p.m. on weeknights, and the biggest local controversy often involves development on the lake’s remaining undeveloped shoreline.
Granbury is best suited for retirees, remote professionals, and families who prioritize a tight-knit community, lake access, and good schools over urban nightlife or career density. The high proportion of older residents means fewer young singles and a quieter social scene, but for those who value a historic downtown, low crime relative to the DFW metro, and a strong sense of place, Granbury delivers a quality of life that justifies its premium cost. Anyone seeking a 24-hour city or a diverse job market should look elsewhere; those wanting a safe, scenic, and civically engaged small town will find Granbury a natural fit.

Crime in Granbury, TX
Lower crime rates than 76% of comparable U.S. locations.
Violent CrimeViolent Crime Analysis
Property CrimeProperty Crime Analysis
Crime Analysis
Granbury, Texas, presents a mixed safety profile: its violent crime rate is notably low, but its property crime rate significantly exceeds both state and national averages. With a violent crime rate of 156.1 per 100,000 residents, Granbury is substantially safer than the national average of roughly 380 per 100,000. However, the property crime rate of 3,522.9 per 100,000 is a clear concern, running well above the Texas average of approximately 2,500 per 100,000 and the national average of about 1,950 per 100,000. This disparity means that while violent incidents are rare, residents face a heightened risk of theft, burglary, and vehicle-related crime.
Crime in context
Granbury’s violent crime rate is a standout positive, sitting at less than half the national average and well below the Texas state rate of roughly 430 per 100,000. This low figure aligns with its character as a smaller, family-oriented community in Hood County. In contrast, the property crime rate is a significant outlier. At 3,522.9 per 100,000, it is about 80% higher than the national average and roughly 40% higher than the Texas average. This suggests that while personal safety is strong, property security requires vigilance. The city’s proximity to the Dallas-Fort Worth metroplex, a large metropolitan area, may contribute to this dynamic, as transient property crime can spill over from the urban core. Furthermore, residents should be aware that progressive judicial philosophies in larger nearby counties can lead to more lenient sentencing, potentially allowing repeat property offenders to cycle back onto the streets more quickly, which directly impacts community safety.
What residents experience
For those living in Granbury, the day-to-day reality is a low fear of violent confrontation but a persistent need to secure belongings. The most common property crimes include theft from vehicles, burglary of sheds and garages, and package theft. The historic downtown square, while a popular attraction, can see higher rates of car break-ins, particularly during festivals and weekends. Residents often report that unlocked vehicles and visible valuables are the primary targets. The low violent crime rate means that neighborhoods generally feel safe for walking and outdoor activities, even in the evening. However, the elevated property crime rate is a consistent topic in local community forums and Nextdoor groups, where neighbors share alerts about suspicious vehicles and recent thefts.
Neighborhood-level variation in Granbury is notable. Established, higher-value areas like the DeCordova Bend Estates and the gated communities around the lake tend to report lower property crime due to private security and more vigilant homeowners. In contrast, areas closer to the main commercial corridors, such as along US-377 and near the Granbury Square, see higher incident rates. Rental-heavy neighborhoods and those with easier highway access also experience more property crime. For the safest experience, prospective residents should prioritize homes with good lighting, security systems, and strong neighborhood watch participation, particularly if they are not in a gated community.
* Values derived from national, state, county, city and local statistics and may differ in a specific area. Last updated: 2026-10-07T18:19:38.000Z
Narrative content on this page is AI-generated and may contain mistakes. Verify any details that matter before acting on them.
ReloMaps may earn a commission from affiliate links at no extra cost to you.

