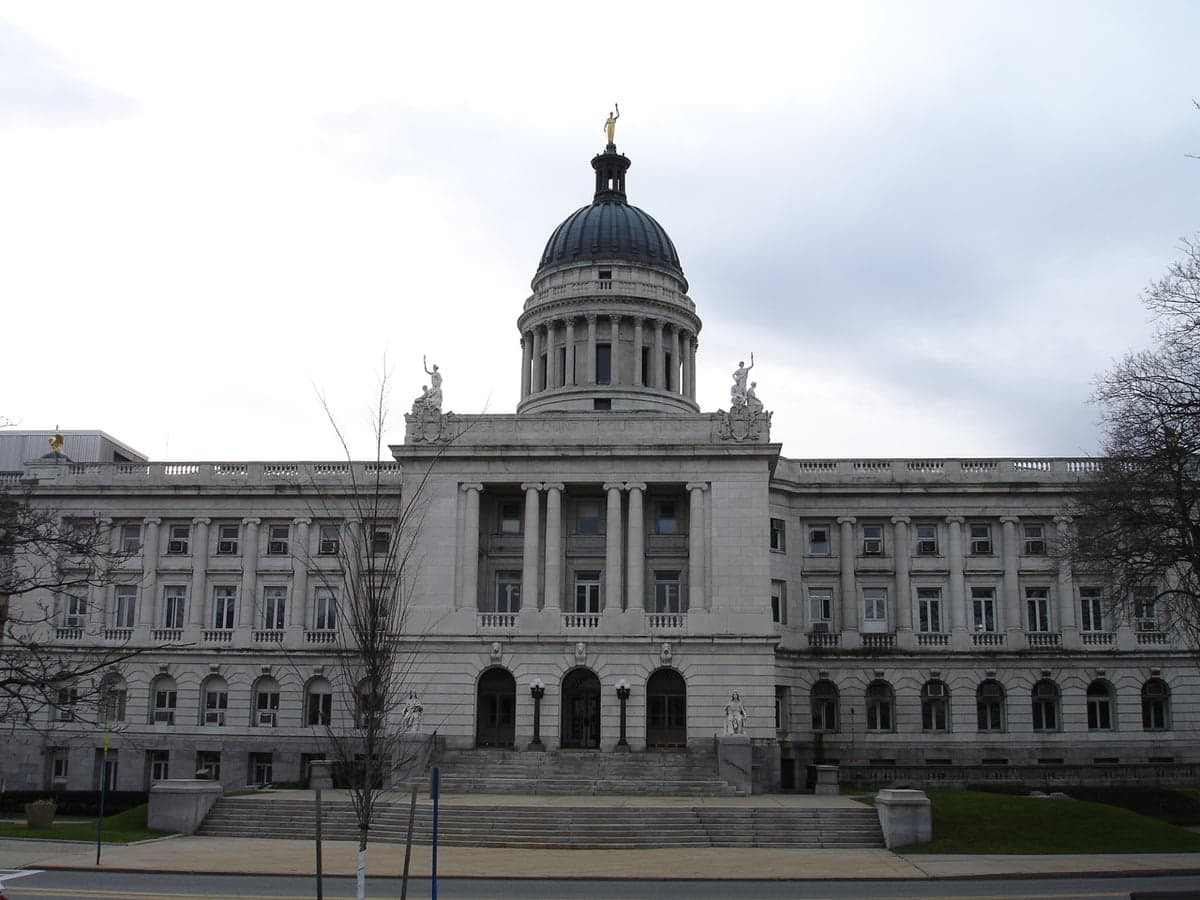
Photo: Wikipedia
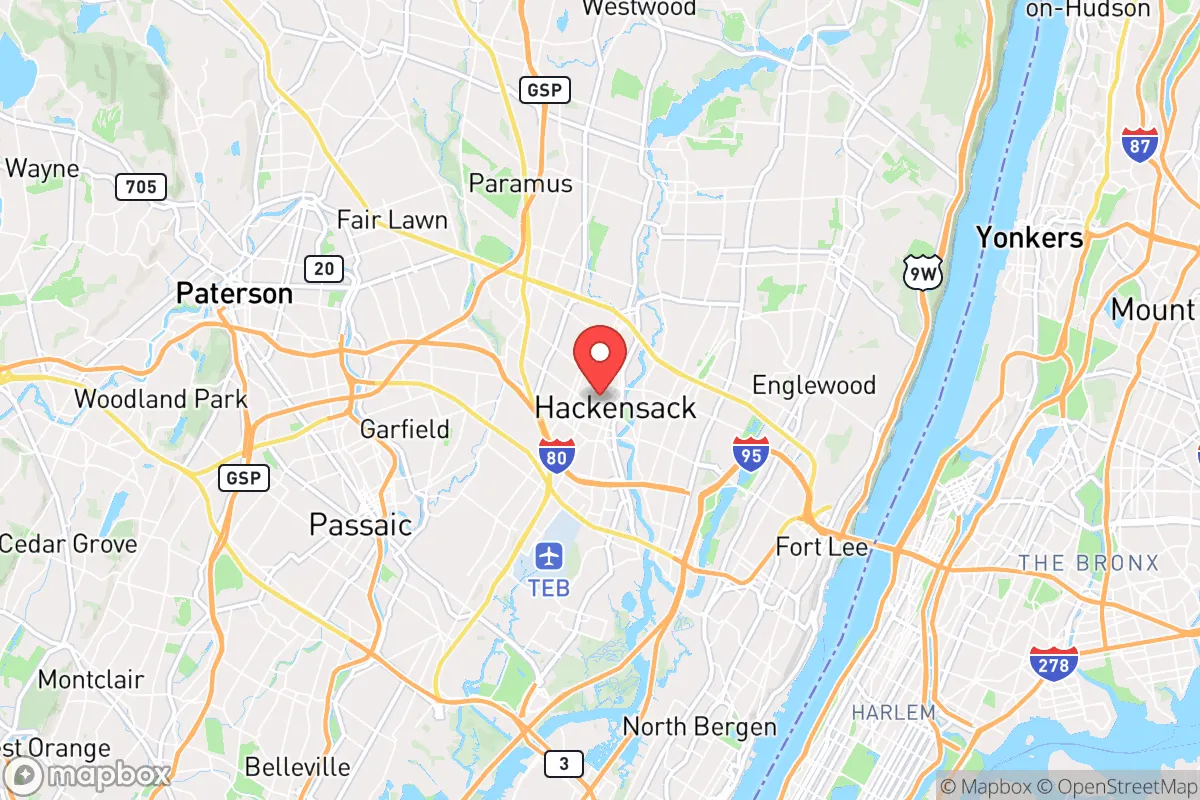
Demographics of Hackensack, NJ
Affluence Level in Hackensack, NJ
A middle-class area roughly in line with national averages across income, home values, education, and employment.
People of Hackensack, NJ
The people of Hackensack, New Jersey today form a dense, majority-minority city of 45,768 residents, characterized by a pronounced Hispanic plurality (36.0%) alongside significant Black (19.7%), White (27.6%), East/Southeast Asian (6.4%), and Indian subcontinent (5.6%) communities. With 15.3% foreign-born and 41.7% college-educated, the city blends working-class immigrant roots with a growing professional class, creating a distinctive identity as a diverse, transit-connected urban hub in Bergen County. The population is notably younger and more ethnically varied than surrounding suburbs, with a density of over 10,000 people per square mile that shapes daily life around tight-knit blocks and bustling commercial corridors.
How the city was settled and grew
Hackensack’s population history begins with the Lenape people, who inhabited the area along the Hackensack River before Dutch and English settlers arrived in the 1600s. The city was formally incorporated in 1693 as part of Bergen Township, with early growth driven by agriculture, milling, and later, the establishment of Bergen County’s seat in 1710. The first major population wave came in the 19th century with German and Irish immigrants, who built homes in the First Ward (the area around Main Street and the river) and worked in the city’s growing brickmaking, shoe, and silk industries. By the early 1900s, Italian and Polish immigrants arrived, settling in the Second Ward (near Prospect Avenue and Union Street) and forming tight ethnic enclaves centered on Catholic parishes like St. Francis of Assisi. The city’s population swelled from about 5,000 in 1880 to over 26,000 by 1930, fueled by industrial jobs and the arrival of the Erie Railroad, which made Hackensack a commuter hub for New York City. The Fairmount neighborhood, developed in the early 20th century, attracted middle-class Jewish families, while the Central Avenue corridor became a commercial spine for the growing community.
Modern era (post-1965)
The 1965 Hart-Cellar Immigration Act reshaped Hackensack’s demographics dramatically. The city’s White population, which had been over 90% in 1960, began declining as suburbanization drew families to newer developments in Paramus and Ridgewood. Simultaneously, new immigrant waves arrived. Hispanic migration—primarily from Puerto Rico, the Dominican Republic, and later Central America—accelerated in the 1970s and 1980s, with families settling in the First Ward and along Main Street, where Spanish-language businesses now dominate. Black residents, many moving from Newark and Paterson during the Great Migration’s later phase, established roots in the Third Ward (around Atlantic Street and the southern end of the city) and the Fairmount area. The 1990s and 2000s saw the arrival of East/Southeast Asian communities—primarily Korean and Filipino—who concentrated in the Central Avenue district and near Hackensack University Medical Center, where many found healthcare jobs. Indian subcontinent families, including Gujarati and Punjabi immigrants, began arriving in the 2000s, settling in the Second Ward and the newer Midtown section near the Hackensack Bus Terminal. By 2020, the city had shifted from a majority-White population to its current plurality-Hispanic makeup, with each ward reflecting distinct ethnic and economic profiles.
The future
Hackensack’s population is heading toward continued diversification and densification, driven by redevelopment along the Hackensack River and near the NJ Transit rail station. The Hispanic share (36.0%) is likely to grow further, as the foreign-born population (15.3%) includes many young families from Latin America, while the White share (27.6%) is expected to continue its gradual decline. The East/Southeast Asian and Indian subcontinent communities, together at 12.0%, are plateauing as second-generation families move to larger homes in nearby suburbs like Fort Lee or Edison. The Black population (19.7%) is stable but aging, with younger Black residents often relocating to southern Bergen County. The city is not homogenizing; instead, it is tribalizing into distinct enclaves—the First Ward remains heavily Hispanic, the Third Ward predominantly Black, and the Central Avenue corridor increasingly Asian and Indian. Over the next 10–20 years, Hackensack will likely become more densely built, with new apartment towers along the river attracting younger, college-educated professionals (41.7% college-educated), while the immigrant neighborhoods maintain their cultural character.
For someone moving in now, Hackensack is becoming a denser, more diverse, and more transit-oriented city—a place where immigrant energy and urban redevelopment coexist, but where neighborhood identity remains strongly tied to ethnicity and ward boundaries. The city offers a vibrant, walkable alternative to suburban Bergen County, with a population that is younger, more international, and more working-class than its neighbors, making it a practical choice for those seeking affordability and connectivity over homogeneity.
* Values derived from national, state, county, city and local statistics and may differ in a specific area. Last updated: 2026-04-25T03:10:02.000Z
Narrative content on this page is AI-generated and may contain mistakes. Verify any details that matter before acting on them.
ReloMaps may earn a commission from affiliate links at no extra cost to you.