Photo: Wikipedia
Quality of Life in Irvine, CA
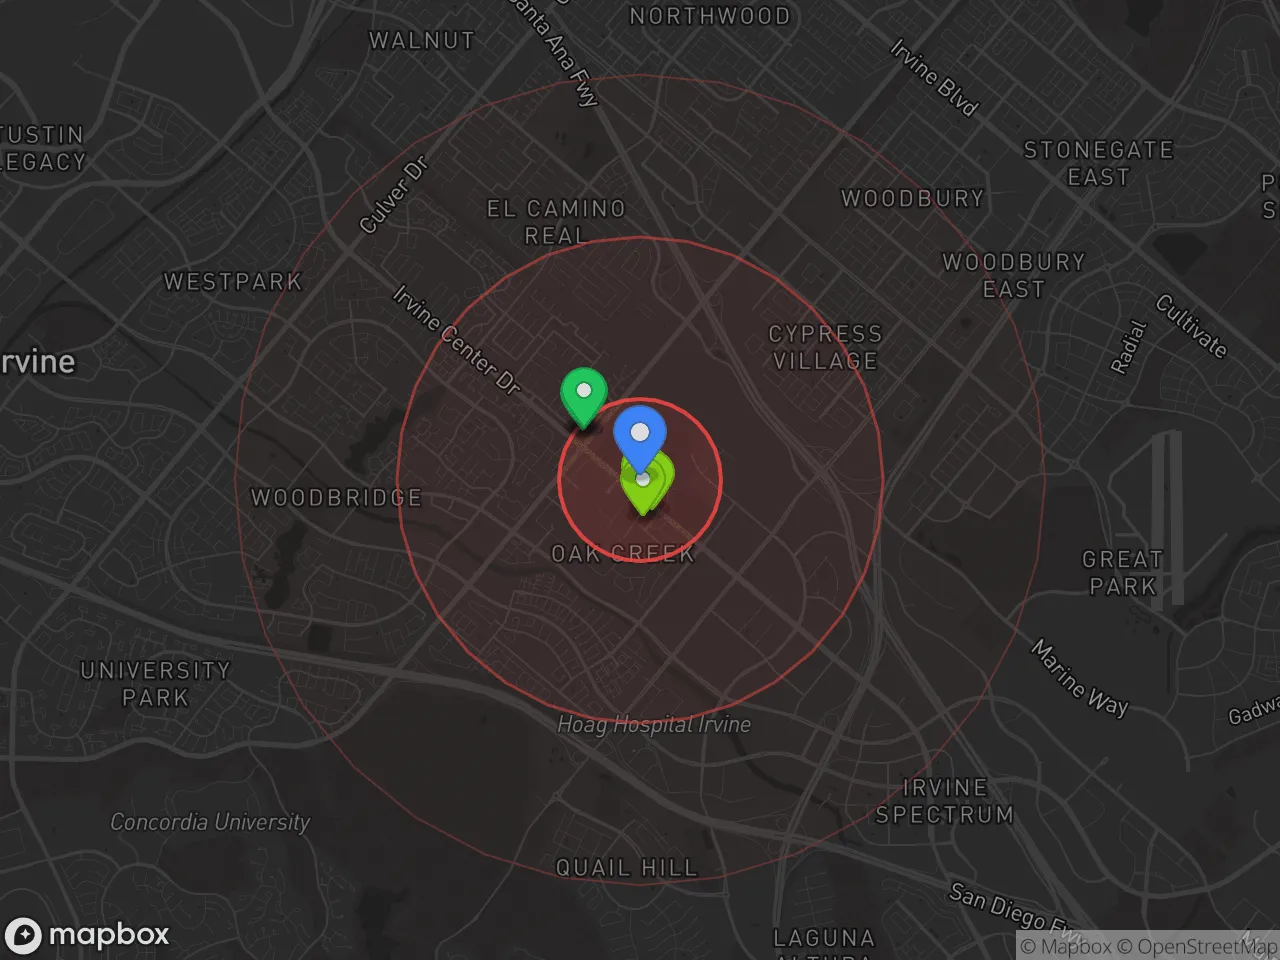
A high quality of life with strong walkability, manageable living costs, healthy neighborhood signals, and solid amenity access.
What does Quality of Life tell us?
Quality of Life blends cost of living, nearby amenities, socioeconomic signals, and neighborhood character. City-level scores represent the whole municipality; individual neighborhoods can differ.
What does this tell us?
Quality of Life blends cost of living, nearby amenities, socioeconomic signals, and neighborhood character. City-level scores represent the whole municipality; individual neighborhoods can differ.
Cost of Living
208% above national average
The Real Cost of Living in Irvine, CA for 2026
| Tier | Individual | Family (4) |
|---|---|---|
| Survival | $46k | $87k |
| Comfortable | $155k | $227k |
| Luxury | $227k+ | $351k+ |
| Elite (Top 5%) | $267k+ | $413k+ |
57%
The Area Signal
A metric tracking the socioeconomic signals of the area.
Hobbies
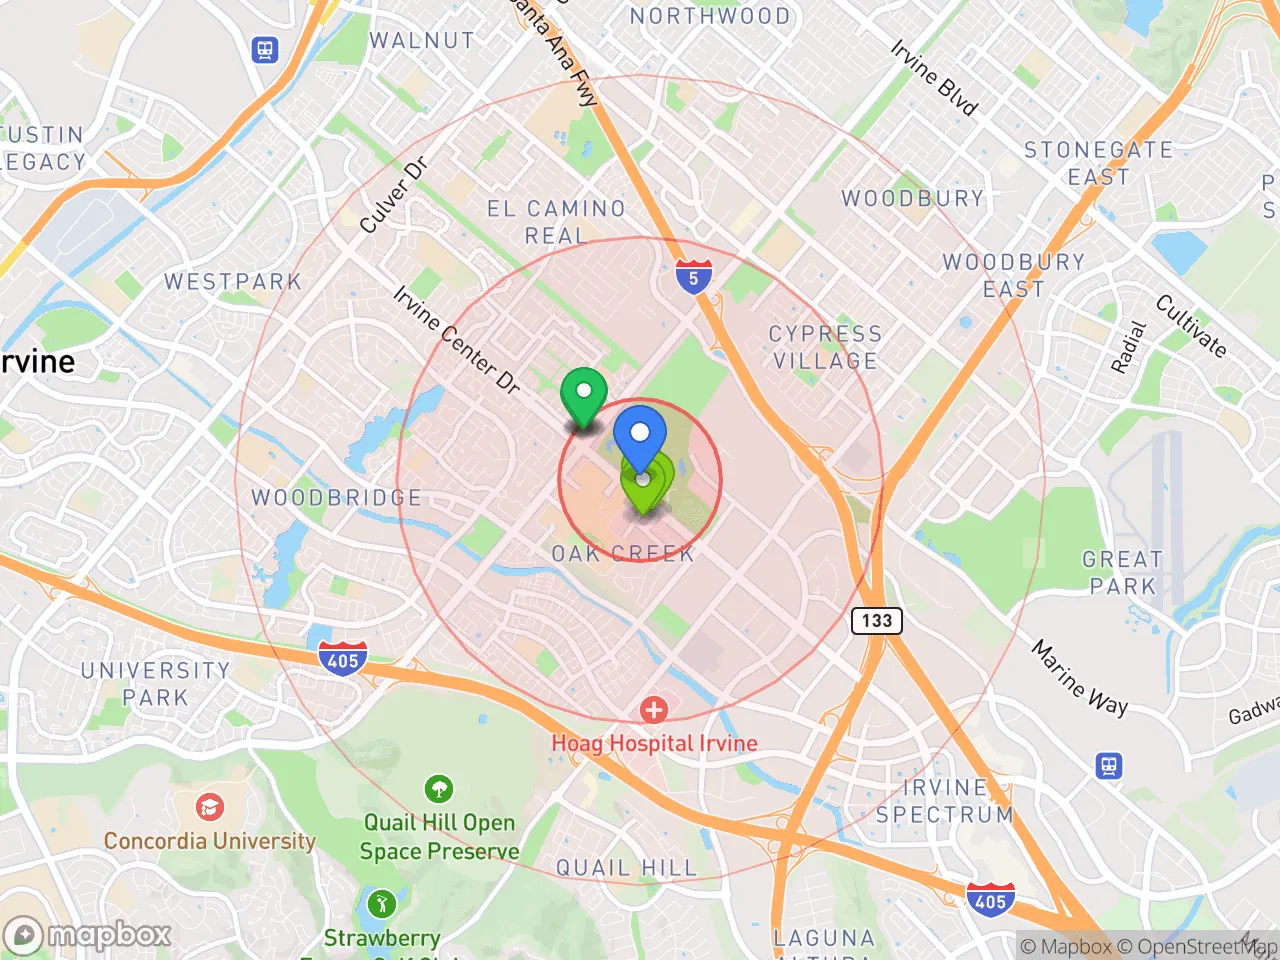
Explore the areaGroceries
6 within 10 miles
Gas
20 within 10 miles
Hospital
20 within 20 miles
Airport
SAN — San Gabriel Valley
Post Office
USPS — Irvine, CA
Critical Amenities
Quality-of-Life Analysis
Irvine, California, is a master-planned city in Orange County known for its high affluence, top-ranked schools, and a predominantly professional, family-oriented population. With a cost of living index of 308 (more than three times the U.S. average), the city attracts well-compensated tech, healthcare, and education workers who prioritize safety, amenities, and long-term property appreciation over low expenses. The population skews heavily toward Asian American and white residents, with a median age of about 35, reflecting a mix of young professionals and established families.
Cost of living, housing affordability, and how Irvine compares to nearby cities
Irvine's cost of living is among the highest in Orange County, driven almost entirely by housing. The median home value sits at $1,115,400, roughly double the national median and significantly above nearby cities like Tustin ($950,000) and Santa Ana ($700,000). Median rent is $2,893, which is about $400 higher than the Orange County average and $1,000 above the national median. While these figures are steep, they are still below the most expensive coastal enclaves like Newport Beach (median home value $2.1 million) and Laguna Beach ($2.5 million). For buyers, the trade-off is strong long-term appreciation — Irvine home values have risen roughly 60% over the past five years. Renters face a tight market with vacancy rates below 3%, making early lease signing and credit scores above 700 essential. Property taxes are capped at roughly 1.1% of assessed value under California's Proposition 13, but HOA fees in many Irvine neighborhoods add $200–$400 monthly.
Top-rated schools, parks, and the daily rhythm of life in Irvine
Daily life in Irvine revolves around its meticulously planned network of parks, trails, and village-style shopping centers. The city boasts over 60 parks and 200 miles of bike trails, with the 1,500-acre Orange County Great Park serving as the central recreational hub. The Irvine Unified School District is a major draw, with all 24 of its K-12 schools rated 8/10 or higher on GreatSchools, and University High School consistently ranking among California's top 20 public high schools. The average commute is 24.3 minutes, notably shorter than the Los Angeles metro average of 30 minutes, thanks to the city's proximity to major employers like the University of California, Irvine (UCI), Blizzard Entertainment, and Edwards Lifesciences. The Spectrum Center and The Market Place provide upscale shopping and dining, while the 405 and 5 freeways offer direct access to San Diego and Los Angeles. Cultural amenities include the Irvine Barclay Theatre and the Irvine Museum, though nightlife is limited compared to nearby Costa Mesa or downtown Santa Ana.
Irvine is best suited for professionals and families who can absorb the high housing costs in exchange for exceptional schools, low crime rates (violent crime is 80% below the national average), and a predictable, well-maintained environment. Single young adults may find the social scene subdued, and retirees on fixed incomes will struggle with the cost of living. However, for those working in Orange County's tech, healthcare, or education sectors, Irvine offers a rare combination of safety, convenience, and long-term property value growth that justifies its premium price tag.
Crime in Irvine, CA
WARNING: The crime statistics are unreliable for this jurisdiction. Local authorities have either not reported or under reported their data to the FBI. This could be due to bad intentions, incompetence or technical issues. Regardless, we suggest skepticism.
Generally safer than 57% of comparable U.S. locations.
Violent CrimeViolent Crime Analysis
Property CrimeProperty Crime Analysis
Crime Analysis
Irvine, California, consistently ranks among the safest cities of its size in the United States, with a violent crime rate of just 78.1 incidents per 100,000 residents and a property crime rate of 1,149.3 per 100,000. These figures place Irvine far below both the California state average and the national average for cities of similar population. However, the city’s location within Orange County—a large metro area with a justice system influenced by progressive policies—means that residents should remain aware of broader regional trends that can affect public safety.
Crime in context
Irvine’s violent crime rate is roughly one-fifth the national average (approximately 380 per 100,000) and well under the California average of about 440 per 100,000. Property crime, while higher than violent crime, still sits below the national benchmark of roughly 1,950 per 100,000. These low numbers are a direct result of the city’s well-funded police department, proactive community policing, and a demographic profile that includes high median incomes and educational attainment. Yet, as part of a large metro area, Irvine is not immune to the effects of regional criminal justice policies. Orange County has seen a shift toward more progressive district attorneys and judges in recent years, which can lead to reduced sentences, early releases, and a greater likelihood of repeat offenses. While Irvine itself remains a statistical outlier for safety, the surrounding metro area’s progressive prosecutorial approach means that criminals apprehended in Irvine may face lighter consequences, potentially increasing recidivism and the risk of property crime spillover.
What residents experience
For daily life, Irvine residents report feeling very safe walking alone at night, using public parks, and shopping in the city’s many retail centers. The most common crimes are property-related—bicycle theft, package theft from porches, and occasional vehicle break-ins—rather than violent confrontations. The Irvine Police Department maintains a visible presence and a rapid response time, which helps deter opportunistic crime. However, the broader context of progressive justice policies in California—such as Proposition 47 (which reclassified many thefts as misdemeanors) and early release programs—means that property crime offenders are often back on the street quickly. This creates a cycle where repeat property crimes are more common than they would be under a stricter sentencing framework. Residents should take standard precautions: lock vehicles, secure packages, and use neighborhood watch programs.
Neighborhood-level variation is minimal in Irvine, as the city is largely homogeneous in terms of safety. Areas near the University of California, Irvine (UCI) campus see slightly higher rates of bicycle theft and minor property crime, while the more affluent communities like Turtle Rock and Shady Canyon report near-zero violent crime. The city’s master-planned design, with gated communities and private security in many neighborhoods, further reduces risk. Nonetheless, the regional justice environment means that even in Irvine, residents cannot assume that offenders will face meaningful consequences, making personal vigilance and community engagement essential for maintaining the city’s exceptional safety record.
* Values derived from national, state, county, city and local statistics and may differ in a specific area. Last updated: 2026-04-24T11:26:41.000Z
Narrative content on this page is AI-generated and may contain mistakes. Verify any details that matter before acting on them.
ReloMaps may earn a commission from affiliate links at no extra cost to you.