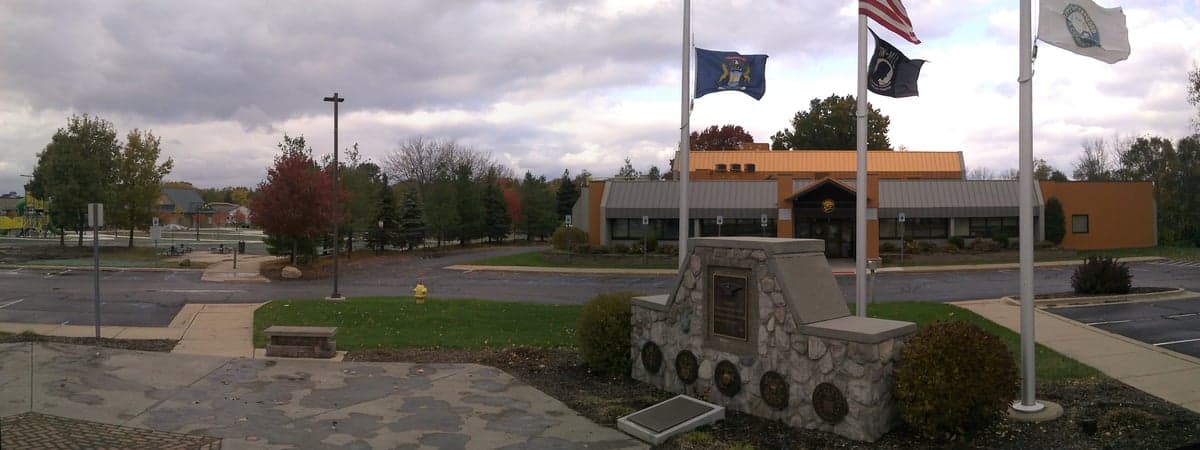
Photo: Wikipedia
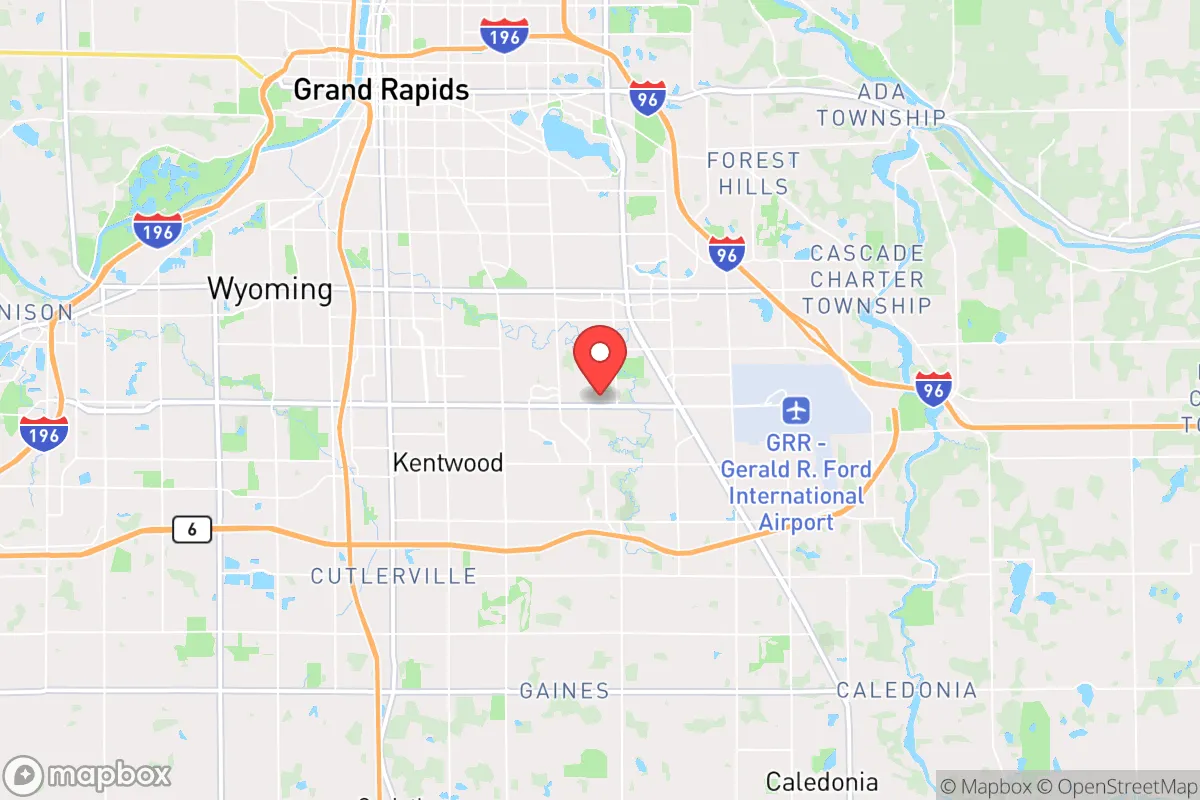
Demographics of Kentwood, MI
Affluence Level in Kentwood, MI
A middle-class area roughly in line with national averages across income, home values, education, and employment.
People of Kentwood, MI
Kentwood, Michigan, is a mid-sized suburban city of 54,114 residents that has transformed from a quiet Dutch-American farming and bedroom community into one of West Michigan’s most racially and ethnically diverse municipalities. The city is characterized by a dense, family-oriented suburban feel, with a population that is 54.6% White, 19.3% Black, 11.1% Hispanic, 7.3% East/Southeast Asian, and 2.5% Indian (subcontinent), alongside a foreign-born share of 9.4%. Its distinctive identity today is that of a working-to-middle-class melting pot, where older Dutch Reformed roots coexist with vibrant immigrant enclaves and a growing professional class drawn by the region’s manufacturing and healthcare economy.
How the city was settled and grew
Kentwood’s human history begins not with a founding settlement but as a sparsely populated farming township carved from the dense forests of the Grand River Valley. The area was originally inhabited by the Odawa and Ojibwe peoples before European-American settlers, overwhelmingly of Dutch and German stock, arrived in the 1830s and 1840s. These early families—names like Kollen, Steketee, and DeVries—established small farms and logging operations. The real growth catalyst was the post-World War II suburban boom. Kentwood was officially incorporated as a city in 1967, explicitly as a planned suburban escape for Grand Rapids’ growing white middle class. The Paris Park neighborhood, with its mid-century ranch homes and large lots, became the primary landing zone for these Dutch-American families moving out of the city’s core. The Eastgate area, anchored by the Eastbrook Plaza shopping center, developed as the commercial and residential heart of this early wave, featuring the modest single-family homes that still define much of the city’s older housing stock.
Modern era (post-1965)
The 1965 Hart-Cellar Act and subsequent shifts in immigration law, combined with the decline of Grand Rapids’ urban core, fundamentally reshaped Kentwood’s population. The first major non-white influx came in the 1970s and 1980s, as Black families moved south from the city’s near-east side, seeking better schools and newer housing. They concentrated in the Pinebrook and Briarwood neighborhoods, areas of 1970s-era split-levels and colonials that offered affordable entry into the suburban middle class. Simultaneously, a wave of Hispanic immigrants—primarily from Mexico and Puerto Rico—began settling in the Kalamazoo Avenue corridor, establishing small businesses and churches that anchor the city’s 11.1% Hispanic community today. The most dramatic recent shift has been the arrival of East/Southeast Asian and Indian (subcontinent) populations, beginning in the 1990s and accelerating after 2000. These groups were drawn by employment at Steelcase, Spectrum Health, and the region’s growing logistics sector. The East Paris Avenue corridor, near the Woodland Mall and the new Meijer headquarters, became a hub for East/Southeast Asian families, while Indian professionals concentrated in newer subdivisions around Beltline Avenue and 60th Street. The city’s Black population has stabilized at 19.3%, while the White share has declined from over 85% in 1990 to 54.6% today, reflecting both out-migration of older Dutch families and the arrival of new groups.
The future
Kentwood’s population is heading toward a continued diversification that is more tribalized into distinct enclaves than homogenized. The White share is likely to continue declining gradually, while the Hispanic and East/Southeast Asian communities are growing through both immigration and higher birth rates. The Indian (subcontinent) population, at 2.5%, is small but highly educated and concentrated in specific subdivisions, showing signs of rapid assimilation into professional networks rather than geographic spread. The Black population appears stable, with growth plateauing as younger families move to farther-out suburbs like Caledonia and Byron Center. The city’s foreign-born share of 9.4% is likely to rise modestly as refugee resettlement programs (particularly for Burmese and Congolese families) continue through local agencies like Bethany Christian Services. The next 10-20 years will likely see Kentwood become a majority-minority city, with no single group dominating, but with distinct ethnic neighborhoods persisting rather than blending into a single melting pot. The Kalamazoo Avenue corridor will remain the Hispanic commercial spine, while East Paris will solidify as an Asian professional hub, and older Dutch-American neighborhoods like Paris Park will see gradual turnover to younger, more diverse families.
For someone moving in now, Kentwood is becoming a genuinely multi-ethnic, middle-class suburb where neighborhood choice strongly correlates with ethnic identity and income level. It offers the stability of a well-managed city with good schools and low crime relative to Grand Rapids, but the social landscape is increasingly segmented by race and origin rather than uniformly suburban. The city’s future is one of managed diversity—distinct communities coexisting rather than fully integrating—which may appeal to those who value cultural enclaves but could feel fragmented to those seeking a single civic identity.
* Values derived from national, state, county, city and local statistics and may differ in a specific area. Last updated: 2026-04-29T20:39:15.000Z
Narrative content on this page is AI-generated and may contain mistakes. Verify any details that matter before acting on them.
ReloMaps may earn a commission from affiliate links at no extra cost to you.