
Photo: Wikipedia
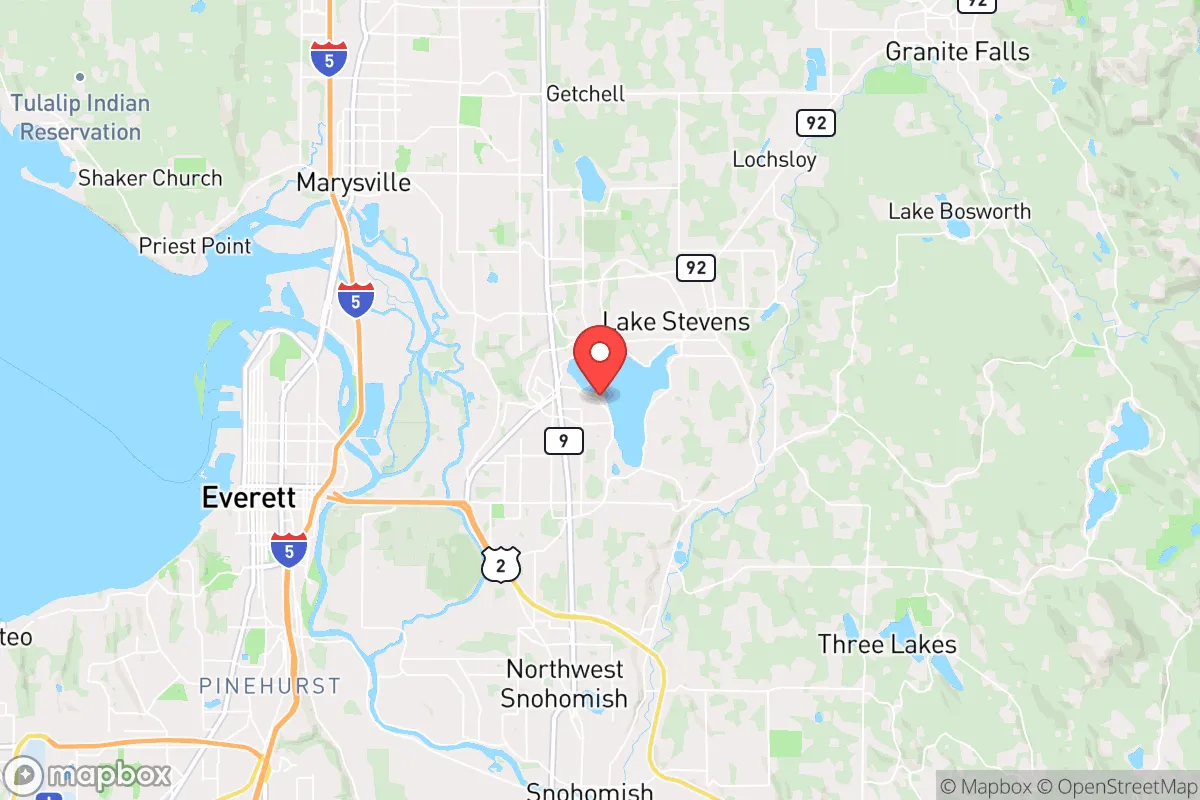
Demographics of Lake Stevens, WA
Affluence Level in Lake Stevens, WA
An upper-middle-class area. Household wealth, education levels, and homeownership run ahead of national benchmarks.
People of Lake Stevens, WA
The people of Lake Stevens, Washington, today number roughly 39,500, forming a predominantly white (71.5%) and family-oriented suburban community with a growing Hispanic (11.2%) and East/Southeast Asian (5.5%) presence. The city’s identity is shaped by its roots as a working-class mill town and its recent transformation into a bedroom community for Everett and Seattle commuters. Distinctive markers include a strong sense of local pride centered on the lake itself, a relatively low foreign-born population (5.1%), and a noticeable divide between older, established neighborhoods and newer master-planned developments. This is a place where the legacy of Scandinavian and Northern European settlers still echoes, even as new waves of residents reshape its demographic character.
How the city was settled and grew
Lake Stevens’ human history begins in the late 19th century, not with colonial settlement but with the arrival of loggers and mill workers drawn by the region’s dense forests. The city’s founding industry was timber, and the first major wave of settlers were predominantly Scandinavian immigrants—Swedes, Norwegians, and Finns—who arrived between 1880 and 1910. These families built the original core of the community in what is now Old Town Lake Stevens, the historic neighborhood clustered around the lake’s eastern shore, where many of the original wood-frame homes still stand. A second early wave came during the 1920s and 1930s, when the construction of the Lake Stevens Dam created a reliable water supply and attracted more workers to the area. These later arrivals, many of them second-generation Scandinavian-Americans and a smaller number of German and Irish families, settled in the Hartford district, a working-class area south of the lake that grew around the local mill and railroad spur. By 1950, Lake Stevens remained a small, insular community of roughly 1,500 people, almost entirely white and native-born, with a culture shaped by logging, fishing, and church life.
Modern era (post-1965)
The post-1965 era brought two major shifts: the suburbanization of the Seattle metro area and the gradual diversification of the population. The 1970s and 1980s saw the first significant domestic in-migration, as families from Everett and north Seattle moved to Lake Stevens seeking larger lots and lower housing costs. This wave settled primarily in the Lake Stevens Heights neighborhood, a hillside area west of the lake that developed with mid-century ranch homes and split-levels. The 1990s and 2000s brought a second, larger wave of domestic migrants, many from California and other western states, who were drawn by the region’s tech-driven economy. These newcomers concentrated in the Catalina and Lundeen Parkway corridor, a fast-growing area of new subdivisions and townhomes. The foreign-born population, while still small at 5.1%, has grown steadily since 2000, driven primarily by Hispanic families working in construction, landscaping, and service industries, and by a smaller but visible East/Southeast Asian community (5.5%) employed in tech and healthcare in nearby Everett. The Indian subcontinent population (2.2%) is a more recent arrival, largely professionals in engineering and IT who have settled in the newer developments along 20th Street SE. The Black population (2.3%) remains small but has grown slightly since 2010, concentrated in the same newer subdivisions. The city’s college-educated share (33.6%) reflects this influx of professionals, though it remains below the Snohomish County average, indicating a still-significant working-class base.
The future
Demographic projections suggest Lake Stevens will continue to grow and diversify, but at a moderate pace. The city’s population is expected to reach roughly 45,000 by 2035, driven by continued infill development and the completion of the Lake Stevens Master Plan, which will add several hundred new homes near the lake’s northern shore. The white share is likely to decline gradually, falling to around 65-68% by 2040, as the Hispanic and East/Southeast Asian populations grow through both immigration and higher birth rates. The Indian subcontinent community, while small, is expected to grow faster than the East/Southeast Asian group, as tech employment in the region expands. The city is not tribalizing into distinct ethnic enclaves; rather, newer neighborhoods like Catalina and Lundeen Parkway are becoming more mixed, while older areas like Old Town and Hartford remain predominantly white and native-born. The foreign-born share is likely to rise to 7-8% by 2040, still low by regional standards. The biggest demographic shift may be generational: as baby boomers age out, younger families—more diverse and more likely to be college-educated—are moving in, gradually reshaping the city’s political and cultural character.
For someone moving to Lake Stevens now, the city is becoming a more diverse, more educated, and more suburban version of its former self. The old mill-town identity is fading, replaced by a commuter-oriented community that offers lake access, good schools, and relative affordability compared to Seattle. The population is not homogenizing but is slowly integrating, with newer residents from different backgrounds mixing in the same subdivisions and schools. This is a place where a conservative-leaning family can still find a strong sense of community and traditional values, but where the demographic and cultural landscape is quietly evolving toward greater plurality.
* Values derived from national, state, county, city and local statistics and may differ in a specific area. Last updated: 2026-04-21T11:11:48.000Z
Narrative content on this page is AI-generated and may contain mistakes. Verify any details that matter before acting on them.
ReloMaps may earn a commission from affiliate links at no extra cost to you.