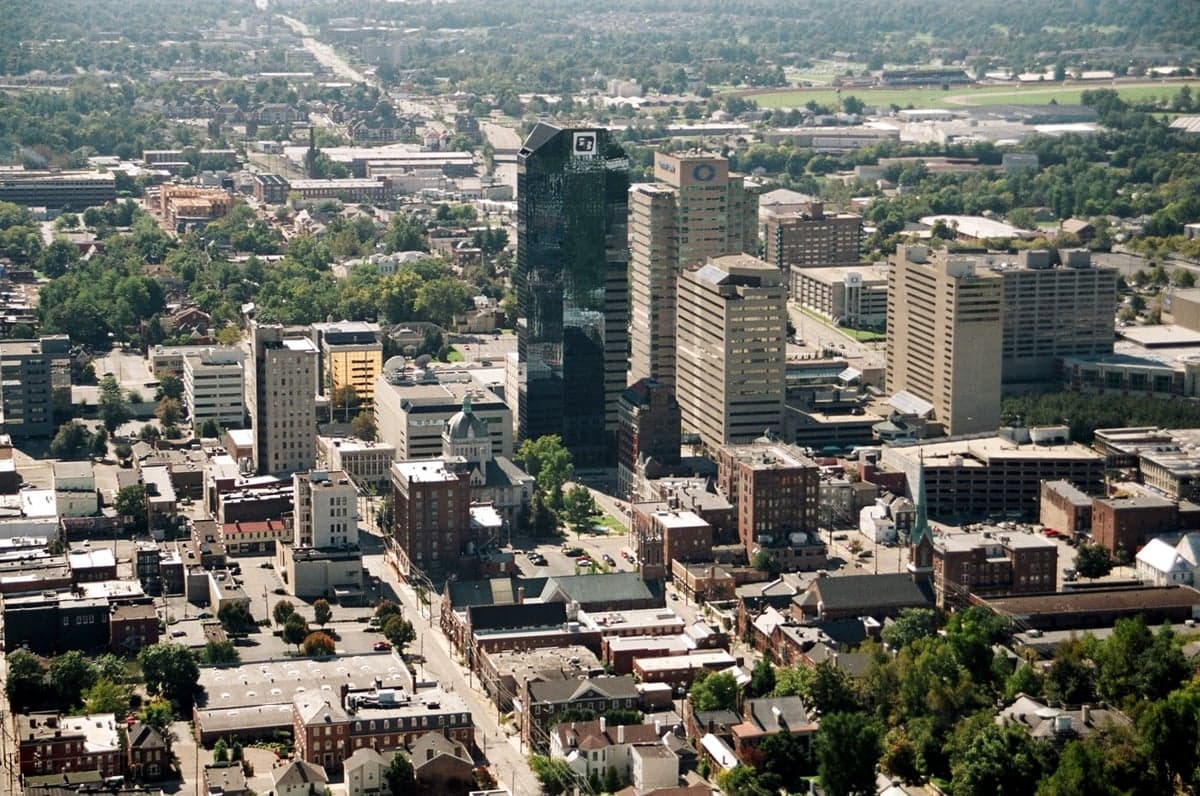
Photo: Wikipedia
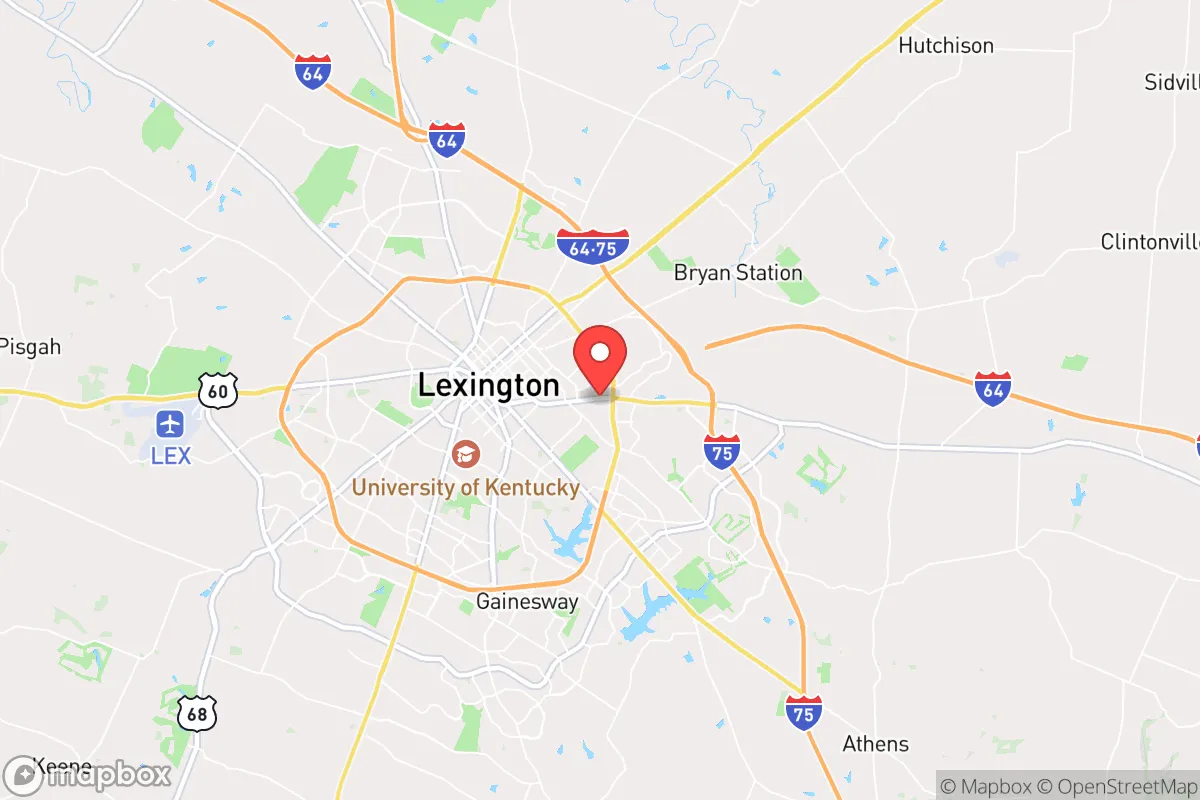
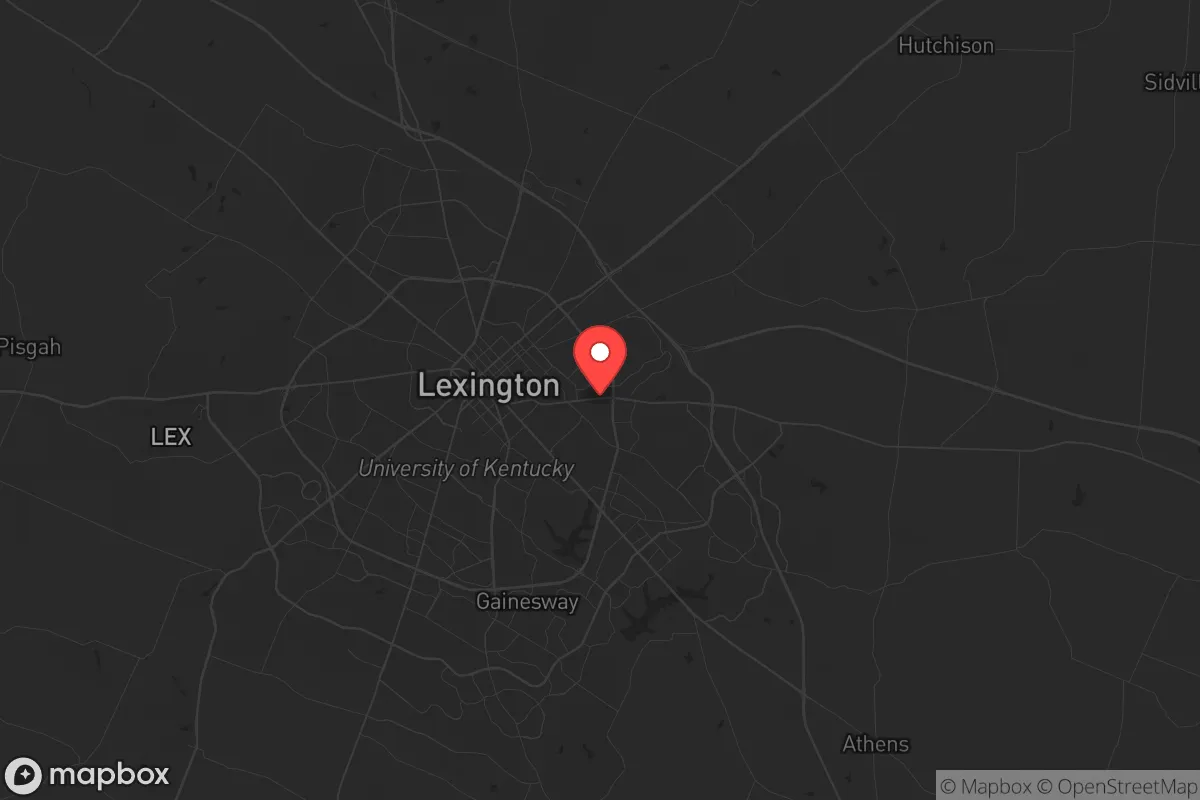
Demographics of Lexington, KY
Affluence Level in Lexington, KY
A middle-class area roughly in line with national averages across income, home values, education, and employment.
People of Lexington, KY
The people of Lexington, Kentucky, today number 321,122, forming a moderately dense, college-educated city with a distinctive blend of Southern tradition and professional-class ambition. The city is majority White (67.8%), with a significant Black population (14.3%) and a growing Hispanic community (9.2%), while East/Southeast Asian residents (2.4%) and Indian-subcontinent residents (1.8%) contribute to a small but visible international presence. With 47.3% of adults holding a bachelor's degree or higher — driven heavily by the University of Kentucky — Lexington feels more cosmopolitan than its Bluegrass surroundings, yet retains a conservative-leaning, family-oriented character. The city's identity is shaped by a historic Black middle class, a large student population, and a steady inflow of professionals from other states, creating a place that is both rooted and in transition.
How the city was settled and grew
Lexington was founded in 1775, when a party of frontiersmen led by William McConnell camped at a spring near what is now the Gratz Park neighborhood, naming the settlement after the Battle of Lexington, Massachusetts. The original population was overwhelmingly of British and Scots-Irish stock, drawn by the Kentucky Land Office's generous land grants — parcels of 200 to 1,000 acres that attracted families from Virginia, Maryland, and Pennsylvania. By the early 1800s, Lexington had become a wealthy hub of the hemp and tobacco trade, and enslaved African Americans constituted roughly half the population. After the Civil War, freedmen established the East End neighborhood, which became the historic heart of Lexington's Black community, anchored by churches, businesses, and the Kentucky Normal and Industrial Institute (now Kentucky State University). The late 19th and early 20th centuries brought a small wave of Lebanese and Syrian immigrants, who settled near Jefferson Street and built a mercantile presence that persists today. The city's growth remained modest through the 1940s, with the population hovering around 60,000, as the economy relied on horse breeding, bourbon distilling, and tobacco.
Modern era (post-1965)
The 1965 Hart-Cellar Act opened the door to new immigration, but Lexington's foreign-born share remains low at 6.9%, reflecting the city's limited history as a gateway. The most significant post-1965 shift has been domestic: the expansion of the University of Kentucky and the rise of Toyota's Georgetown plant (1988, 15 miles north) drew thousands of professionals and factory workers from across the Midwest and South. Suburbanization pushed White and middle-class Black families outward into neighborhoods like Hamburg (a planned, master-developed area in the southeast) and Beaumont (southwest), while the East End and Northside experienced disinvestment and population loss. The Hispanic population grew from negligible in 1990 to 9.2% today, concentrated in the Cardinal Valley neighborhood, where Mexican and Central American immigrants work in construction, landscaping, and the horse industry. East/Southeast Asian residents (2.4%) are clustered near the University of Kentucky campus and in the Chevy Chase area, many connected to the university's graduate programs and medical center. The Indian-subcontinent population (1.8%) is smaller but growing, with professionals in engineering and healthcare settling in Hamburg and Beaumont. The Black population share has declined from roughly 20% in 1970 to 14.3% today, as middle-class families have suburbanized and younger Black residents have left for larger Southern cities like Atlanta and Charlotte.
The future
Lexington's population is projected to grow modestly, reaching roughly 350,000 by 2040, driven by natural increase and continued domestic in-migration from the Midwest and Northeast. The city is not homogenizing; rather, it is tribalizing into distinct enclaves by income and ethnicity. The Hispanic population in Cardinal Valley is likely to grow and spread into adjacent Winchester Road corridors, while the East/Southeast Asian and Indian communities will remain small but stable, concentrated near the university and in upscale suburbs. The Black population is plateauing, with little new immigration and continued out-migration of younger adults. The White population is aging in place in established neighborhoods like Ashland Park and Kenwick, while younger White professionals gravitate toward the Distillery District and downtown condos. The foreign-born share may rise to 8-9% by 2040, but Lexington will remain a predominantly native-born, English-speaking city — a contrast to the rapid diversification seen in Nashville or Louisville.
For someone moving in now, Lexington offers a stable, family-oriented environment with good schools, a strong job market anchored by healthcare and education, and a conservative-leaning political culture that values tradition and order. The city is not a melting pot in the classic sense, but a collection of distinct, stable neighborhoods where newcomers can find their niche. The bottom line: Lexington is becoming more suburban, more professional, and slightly more diverse, but it remains a fundamentally Southern city where community ties and local identity matter more than rapid demographic change.
* Values derived from national, state, county, city and local statistics and may differ in a specific area. Last updated: 2026-05-07T10:56:38.000Z
Narrative content on this page is AI-generated and may contain mistakes. Verify any details that matter before acting on them.
ReloMaps may earn a commission from affiliate links at no extra cost to you.