


Photo: Wikipedia
Quality of Life in Lexington, KY
Above-average quality of iife. The area offers a reasonable cost of living, decent mobility, and a mix of neighborhood amenities.
What does Quality of Life tell us?
Quality of Life blends cost of living, nearby amenities, socioeconomic signals, and neighborhood character. City-level scores represent the whole municipality; individual neighborhoods can differ.
What does this tell us?
Quality of Life blends cost of living, nearby amenities, socioeconomic signals, and neighborhood character. City-level scores represent the whole municipality; individual neighborhoods can differ.
Cost of Living
5% below national average
The Real Cost of Living in Lexington, KY for 2026
| Tier | Individual | Family (4) |
|---|---|---|
| Survival | $18k | $33k |
| Comfortable | $53k | $78k |
| Luxury | $122k+ | $189k+ |
| Elite (Top 5%) | $166k+ | $258k+ |
87%
The Area Signal
A metric tracking the socioeconomic signals of the area.
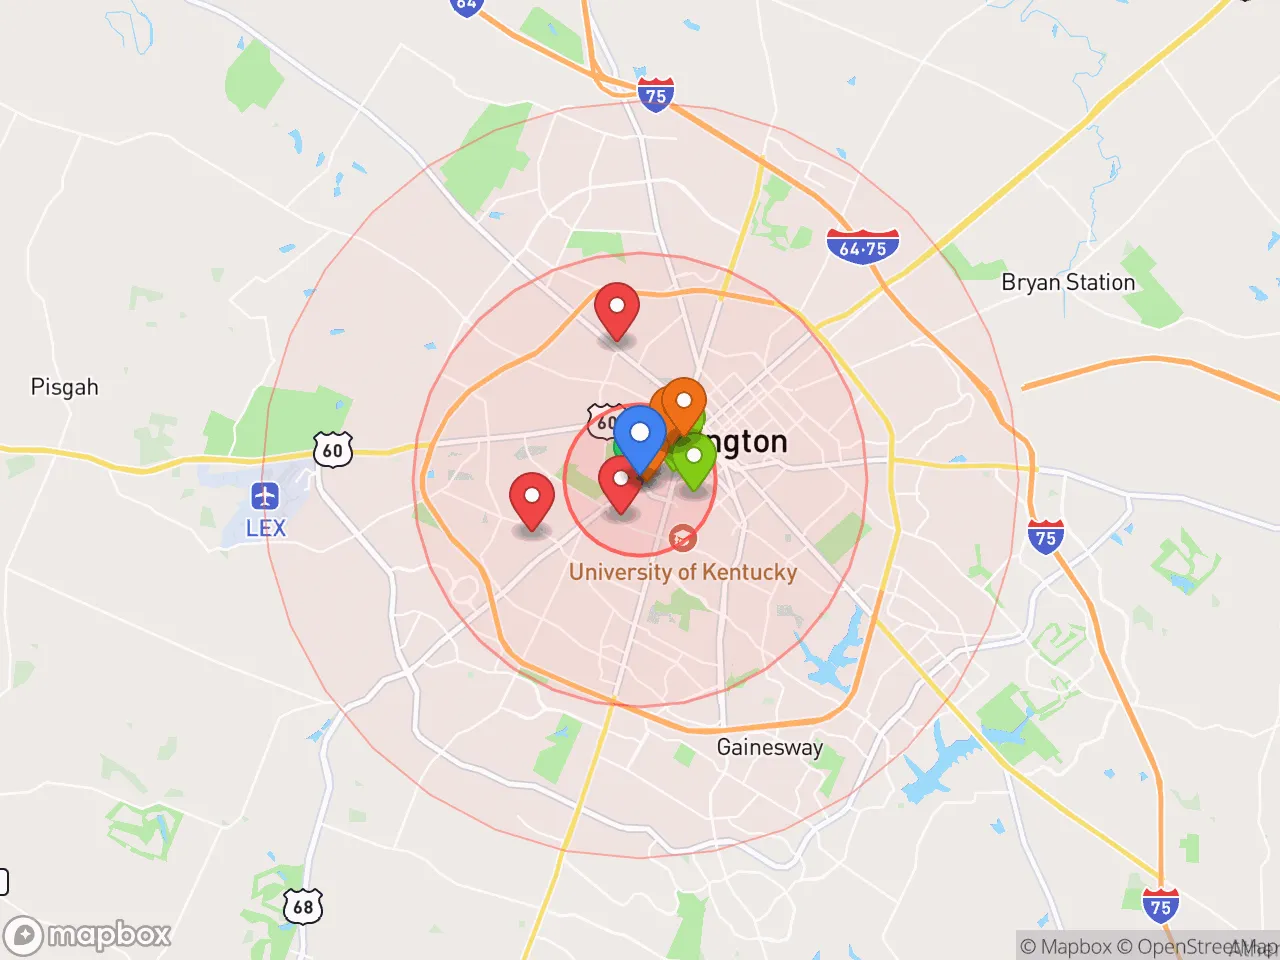
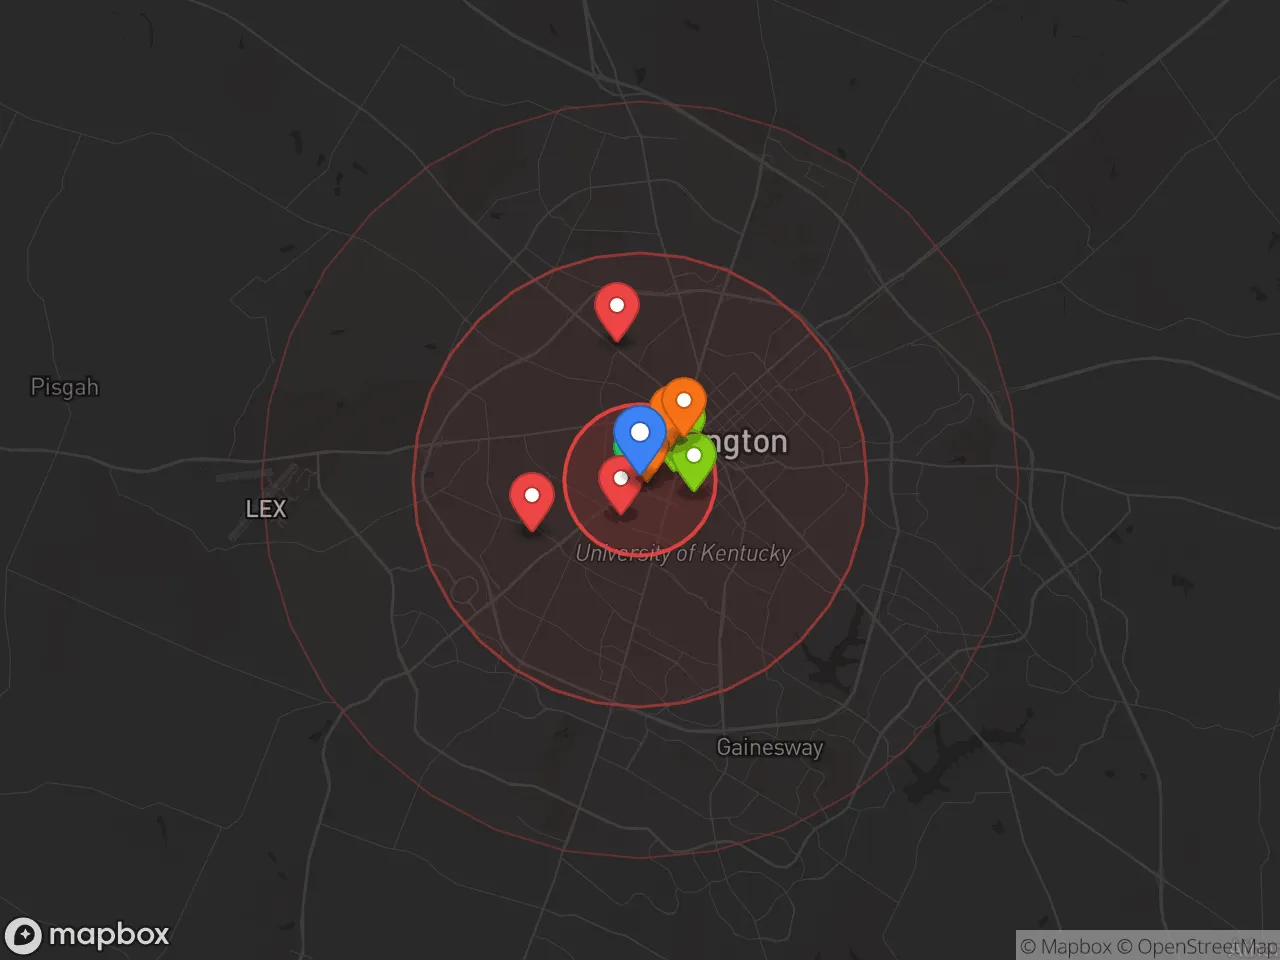
Hobbies
Explore the areaGroceries
6 within 10 miles
Gas
20 within 10 miles
Hospital
19 within 20 miles
Airport
Indianapolis International Airport
Post Office
USPS — Lexington, KY
Critical Amenities
Quality-of-Life Analysis
Lexington, Kentucky, presents a quality of life defined by a cost of living that undercuts the national average while offering a distinctly urban-rural blend, attracting a mix of university faculty, healthcare professionals, and young families. The city’s affluence is moderate and widely distributed, with a median household income that comfortably supports the area’s housing costs, creating a stable, middle-to-upper-middle-class environment. This is not a boomtown of extreme wealth, but a steady, well-educated community anchored by the University of Kentucky and a robust healthcare sector, where residents prioritize access to culture, education, and the outdoors over high salaries.
Cost of living and housing affordability compared to nearby areas
Lexington’s overall cost of living index sits at 95, meaning everyday expenses are roughly 5% below the U.S. average, a significant advantage over pricier regional hubs like Nashville or Cincinnati. The housing market is the primary driver of this affordability: the median home value is $272,100, which is notably lower than the national median of roughly $350,000 and far below the $400,000+ averages seen in comparable college towns like Ann Arbor or Madison. Renters also benefit, with a median rent of $1,101, making Lexington one of the more accessible rental markets in the Southeast for a city of its size. When compared to nearby Louisville (COL index ~92) or Richmond, KY (COL index ~88), Lexington is slightly pricier, but it offers a significantly higher density of amenities, employment options, and cultural institutions, justifying the modest premium for most relocating professionals.
Daily life, schools, and local amenities
The rhythm of daily life in Lexington is shaped by a short average commute of 20.8 minutes, well below the national average of 26 minutes, which frees up time for the city’s abundant outdoor and cultural pursuits. The Fayette County Public Schools system is the largest in the state and includes highly rated magnet and traditional programs, such as Paul Laurence Dunbar High School and Henry Clay High School
Crime in Lexington, KY
Crime rates similar to the national median for U.S. locations.
Violent CrimeViolent Crime Analysis
Property CrimeProperty Crime Analysis
Crime Analysis
Lexington, Kentucky, presents a mixed safety profile where property crime rates significantly exceed national averages, while violent crime remains below the U.S. norm. The city’s overall crime rate is heavily influenced by its status as a large metro area with a progressive judicial philosophy, which critics argue prioritizes offender rehabilitation over public safety, potentially contributing to higher recidivism and a greater number of criminals on the street. For prospective residents, understanding these dynamics is essential for making an informed relocation decision.
Crime in context
Lexington’s violent crime rate stands at 225.1 incidents per 100,000 residents, which is notably lower than the national average of roughly 380 per 100,000. However, property crime tells a different story: the city reports 2,054.7 property crimes per 100,000, a figure that exceeds the U.S. average of approximately 1,950 per 100,000. When compared to the state of Kentucky, Lexington’s violent crime rate is slightly above the state average (around 210 per 100K), while its property crime rate is markedly higher than the Kentucky average of roughly 1,800 per 100K. These numbers reflect a broader trend in larger metro areas where progressive district attorneys and judges, sympathetic to offenders, often implement lenient sentencing and diversion programs. While intended to reduce incarceration, such policies can lead to more criminals cycling back onto the streets, directly impacting property crime rates and public confidence in the justice system.
What residents experience
Daily life in Lexington involves navigating a city where property crimes—particularly theft, burglary, and vehicle break-ins—are the most common safety concerns. Residents frequently report incidents of package theft and car break-ins, especially in neighborhoods near the University of Kentucky campus and commercial corridors like Nicholasville Road. Violent crime, while less frequent, does occur and is often concentrated in specific areas. The progressive approach of local courts, which emphasizes treatment and alternative sentencing for non-violent offenders, has drawn criticism from those who feel it undermines justice for victims and the public. For example, Fayette County’s pretrial release policies have been cited by law enforcement as a factor in repeat offenses, as individuals arrested for property crimes are often released quickly, only to reoffend. This cycle creates a sense of unease, particularly among homeowners and small business owners who bear the brunt of property crime.
Neighborhood-level variation is significant. Areas like Chevy Chase and Ashland Park generally report lower crime rates, while parts of the Northside and East End see higher incidents of both property and violent crime. Suburban communities such as Hamburg and Brannon Crossing offer a safer environment but are not immune to property crime. Ultimately, Lexington’s safety landscape is shaped by its progressive judicial policies, which, while well-intentioned, may leave residents feeling that the system prioritizes offenders over the safety of law-abiding citizens. Prospective movers should research specific neighborhoods and consider the broader implications of the local justice system on long-term safety and community well-being.
* Values derived from national, state, county, city and local statistics and may differ in a specific area. Last updated: 2026-05-07T10:56:38.000Z
Narrative content on this page is AI-generated and may contain mistakes. Verify any details that matter before acting on them.
ReloMaps may earn a commission from affiliate links at no extra cost to you.