


Photo: Wikipedia
Quality of Life in Lexington, SC
Above-average quality of iife. The area offers a reasonable cost of living, decent mobility, and a mix of neighborhood amenities.
What does Quality of Life tell us?
Quality of Life blends cost of living, nearby amenities, socioeconomic signals, and neighborhood character. City-level scores represent the whole municipality; individual neighborhoods can differ.
What does this tell us?
Quality of Life blends cost of living, nearby amenities, socioeconomic signals, and neighborhood character. City-level scores represent the whole municipality; individual neighborhoods can differ.
Cost of Living
9% above national average
The Real Cost of Living in Lexington, SC for 2026
| Tier | Individual | Family (4) |
|---|---|---|
| Survival | $22k | $41k |
| Comfortable | $53k | $77k |
| Luxury | $126k+ | $196k+ |
| Elite (Top 5%) | $149k+ | $230k+ |
108%
The Area Signal
A metric tracking the socioeconomic signals of the area.
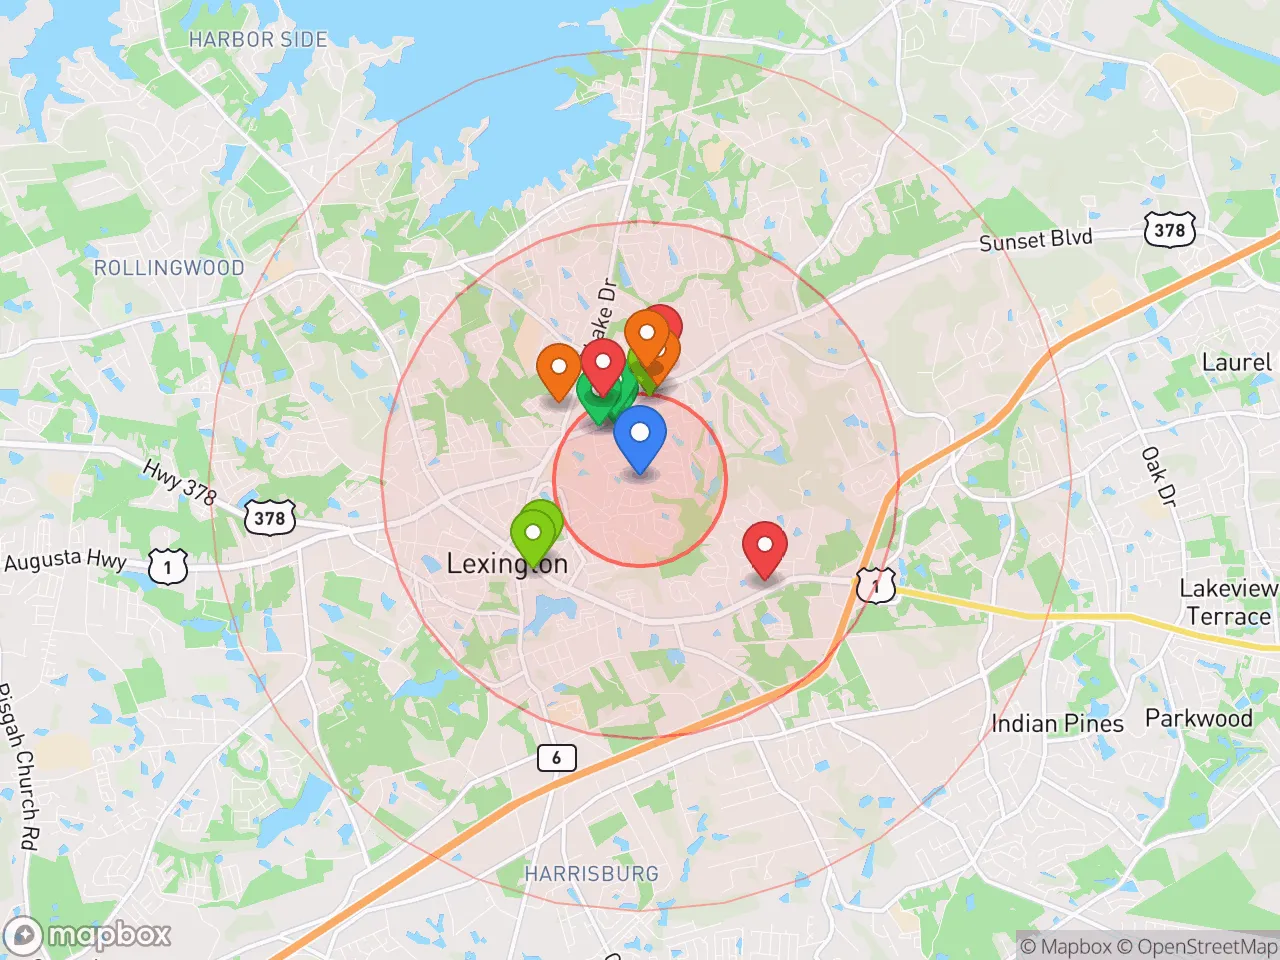

Hobbies
Explore the areaGroceries
9 within 10 miles
Gas
20 within 10 miles
Hospital
13 within 20 miles
Airport
CLT — Charlotte Douglas International
Post Office
USPS — Lexington, SC
Critical Amenities
Quality-of-Life Analysis
Lexington, South Carolina, is an affluent suburb of Columbia that attracts families and professionals seeking a blend of small-town charm and metropolitan access. With a cost-of-living index of 109 (slightly above the national average of 100), the town offers a notably higher standard of living than many comparably priced areas in the Southeast. The population skews toward homeowners, married couples, and college-educated residents, creating a stable, family-oriented community where median household incomes outpace state averages.
Cost of living, housing affordability, and how it compares to Columbia
Lexington’s cost of living is 9% above the U.S. average, driven primarily by housing demand in a tight market. The median home value sits at $271,200, which is roughly 15% higher than the Columbia metro median of around $235,000, reflecting Lexington’s desirability as a bedroom community. Median rent is $1,360 per month, about $150 more than in downtown Columbia, though still below the national rental average of $1,500. For buyers, the trade-off is clear: Lexington offers newer housing stock, larger lots, and lower property tax rates (roughly 0.5% of assessed value) compared to Richland County across the river. The average commute of 23.99 minutes is manageable, with most residents driving west on I-20 or US-378 into Columbia for work. While housing costs have risen 8-10% annually since 2020, Lexington remains more affordable than Charleston or Greenville for similar suburban quality.
Schools, amenities, and what daily life feels like for families
Lexington’s daily rhythm centers on its highly rated public schools, part of Lexington County School District One, which consistently ranks among South Carolina’s top districts for test scores and graduation rates (above 90%). The town’s amenities include the sprawling Lake Murray waterfront, with public parks, boat ramps, and the 50-mile Saluda Riverwalk trail system. Downtown Lexington’s Main Street features locally owned restaurants, a farmers market, and seasonal events like the Lexington County Peach Festival. For shopping and services, the Lexington Village and the nearby Columbiana Centre mall provide big-box retail within a 10-minute drive. Healthcare access is solid, with Lexington Medical Center (a 500+ bed facility) serving as the region’s largest employer and a top-rated hospital for cardiac and orthopedic care. The area lacks extensive nightlife or cultural venues, but Columbia’s theaters, museums, and university events are a 20-minute drive away. Traffic on I-20 and US-378 can back up during peak hours, pushing some commutes toward 35 minutes.
Lexington is best suited for families, mid-career professionals, and retirees who prioritize good schools, safe neighborhoods, and outdoor recreation over urban energy. The town’s political leanings are conservative, with Lexington County voting +18 points Republican in the 2024 presidential election, which aligns with its low-tax, pro-business environment. Those seeking walkable urban density or a vibrant arts scene may find Lexington too quiet, but for buyers wanting a strong school system, lake access, and a 24-minute commute to Columbia’s job centers, it offers a compelling suburban package. The housing market remains competitive, with inventory below two months of supply, so prospective residents should be prepared to act quickly on listings.
Crime in Lexington, SC
Lower crime rates than 80% of comparable U.S. locations.
Violent CrimeViolent Crime Analysis
Property CrimeProperty Crime Analysis
Crime Analysis
Lexington, South Carolina, presents a mixed safety profile that is significantly safer than national averages for violent crime but notably higher in property crime, reflecting patterns common in rapidly growing suburbs of a major metropolitan area. The town's violent crime rate stands at 170.5 incidents per 100,000 residents, well below the national average, while its property crime rate of 1,162.8 per 100,000 exceeds both state and national benchmarks. As a suburb of Columbia, Lexington benefits from the economic opportunities of a large metro area but also inherits the property crime pressures that accompany proximity to a larger urban center.
Crime in context
Lexington's violent crime rate is roughly half the national average, making it one of the safer municipalities in the Columbia metropolitan statistical area for personal safety. However, the property crime rate is approximately 20% higher than the national average and notably above the South Carolina state average of roughly 2,900 per 100,000. This disparity is typical for affluent suburbs that attract property crime from nearby urban areas. The town's location along Interstate 20 and its proximity to Columbia—just 12 miles west—create easy access for criminals operating across jurisdictional lines. Residents should be aware that property crime, particularly vehicle break-ins and package thefts, is the primary safety concern rather than violent confrontations.
What residents experience
Daily life in Lexington for most residents involves low risk of violent victimization, with the town recording no homicides in several recent years. The most common crimes reported are larceny-theft, burglary, and motor vehicle theft. Lexington's police department maintains a visible presence, and community policing initiatives are active, but the sheer volume of property crime—nearly 1,200 incidents per 100,000 residents—means that roughly 1 in 86 households experiences a property crime annually. A significant concern for the broader Lexington County area is the influence of progressive judicial policies in the Columbia metro region. Lexington County itself elects a Republican-leaning sheriff and solicitor, but cases can be affected by policies originating in Richland County (Columbia), where liberal district attorneys and judges may prioritize diversion programs over incarceration. This ideological approach, while intended to reduce recidivism, often results in repeat property offenders cycling quickly back onto the streets, directly undermining public safety and victim justice in surrounding communities like Lexington.
Neighborhood-level variation is pronounced. Established subdivisions like those off Corley Mill Road and near Lake Murray typically report lower crime rates, while areas closer to major commercial corridors such as Sunset Boulevard and the Lexington Medical Center district see higher property crime volumes. Gated communities and those with active neighborhood watch programs report significantly fewer incidents. Prospective residents should examine crime maps for specific subdivisions, as Lexington's safety reputation is not uniform—the town's overall low violent crime rate masks pockets where property crime is a persistent nuisance. The town's growth, with population increasing over 30% since 2010, continues to strain police resources and may affect future crime trends.
* Values derived from national, state, county, city and local statistics and may differ in a specific area. Last updated: 2026-04-29T17:51:16.000Z
Narrative content on this page is AI-generated and may contain mistakes. Verify any details that matter before acting on them.
ReloMaps may earn a commission from affiliate links at no extra cost to you.