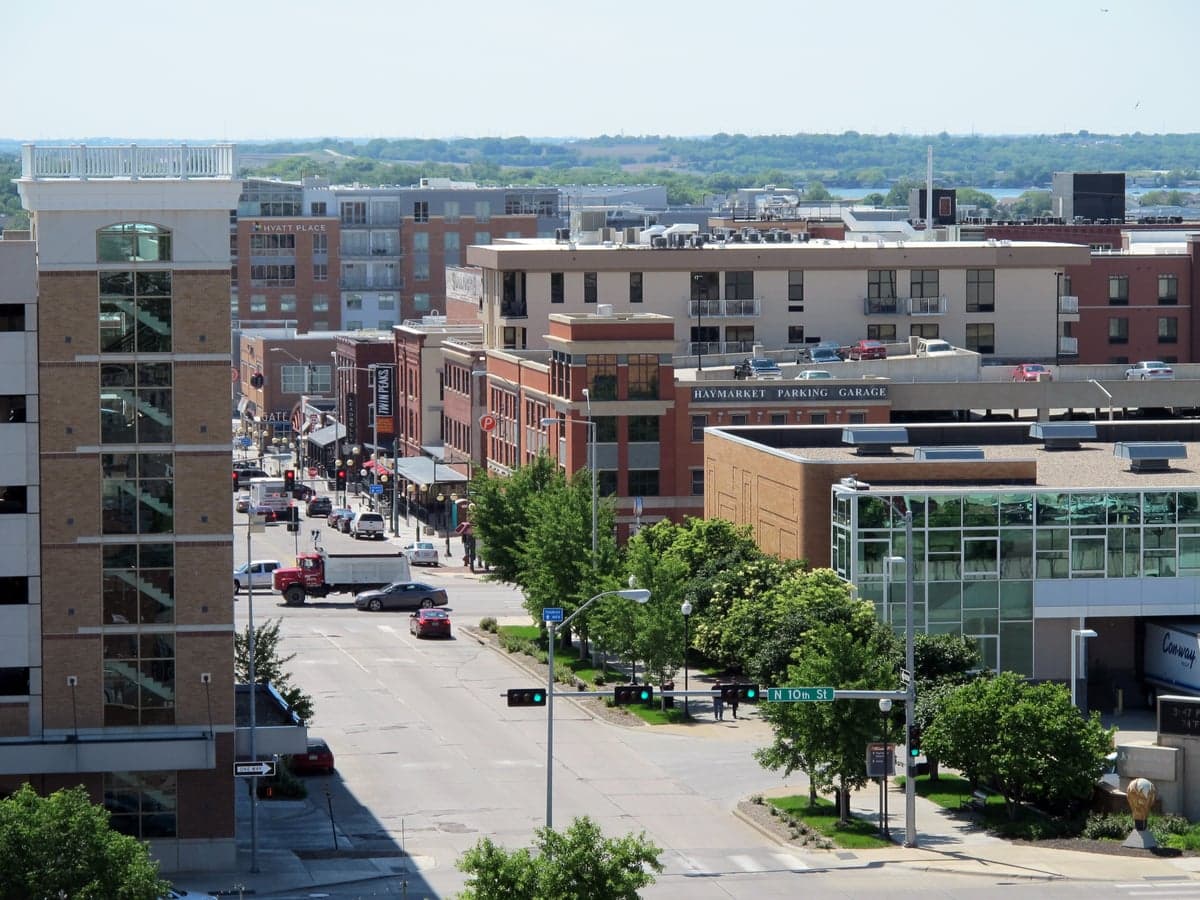
Photo: Wikipedia
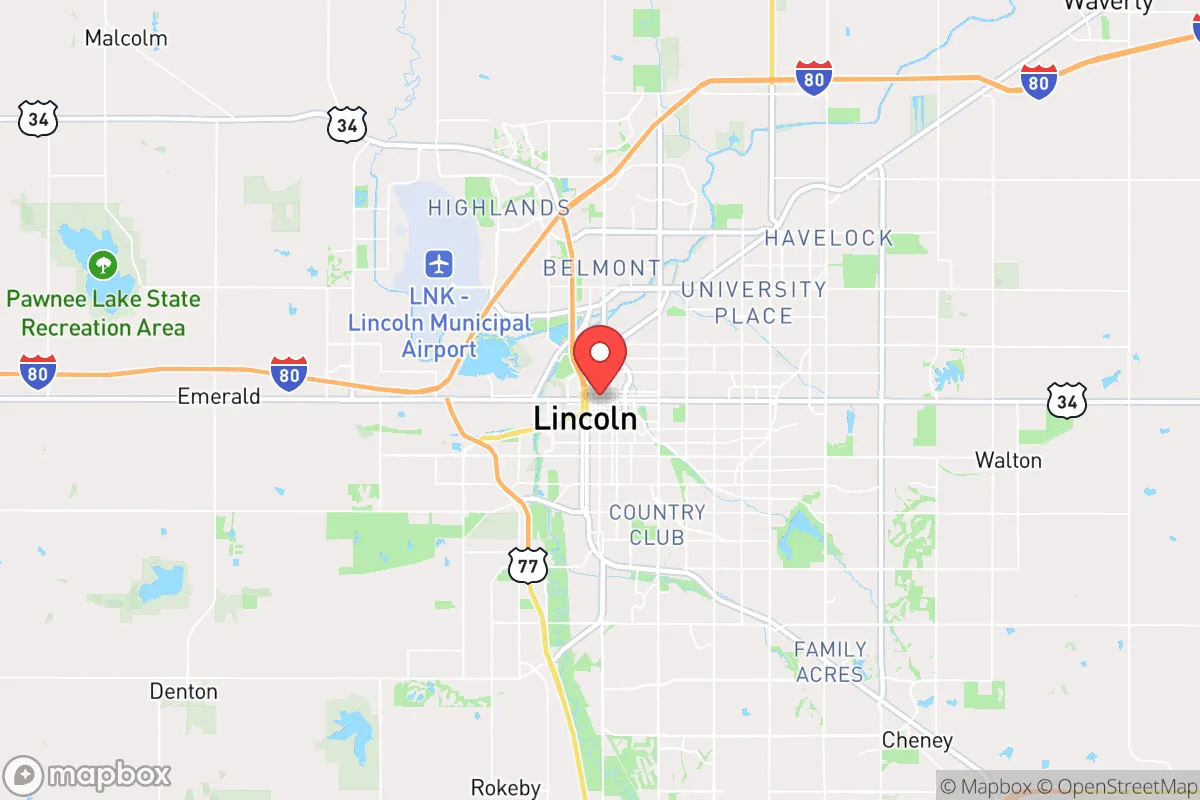
Demographics of Lincoln, NE
Affluence Level in Lincoln, NE
A middle-class area roughly in line with national averages across income, home values, education, and employment.
People of Lincoln, NE
The people of Lincoln, Nebraska, today number 291,932 and form a population that is notably more white (77.2%) and less foreign-born (4.5%) than the national average, yet increasingly diverse in its younger cohorts. The city’s identity is shaped by a blend of historic German and Czech roots, a large state-government and university workforce, and a growing Hispanic and East/Southeast Asian presence that is slowly shifting the city’s character. Lincoln remains a relatively stable, family-oriented community with a high college attainment rate (41.0%), but its demographic future is being written in the neighborhoods where new immigrants and young professionals are settling.
How the city was settled and grew
Lincoln was founded in 1856 as the village of Lancaster, but its real growth began in 1867 when it was chosen as the state capital after Nebraska achieved statehood. The original population was overwhelmingly native-born white settlers from the Midwest and Northeast, drawn by the promise of cheap land under the Homestead Act and the stability of state-government employment. By the 1880s, German and Czech immigrants formed the largest foreign-born groups, establishing tight-knit communities in the Near South and Clinton neighborhoods, where their churches, social halls, and grocery stores anchored daily life. The arrival of the Union Pacific and Burlington railroads in the 1870s brought Irish and Swedish laborers, who settled in working-class areas like Havelock (originally a separate railroad town) and the North Bottoms district near the rail yards. By 1900, Lincoln’s population had reached 40,000, and the city’s character as a government-and-education hub was already set. The Great Depression and World War II slowed immigration, but the post-war baby boom and expansion of the University of Nebraska-Lincoln (UNL) drove a new wave of domestic in-migration, filling suburban tracts like Eastridge and Colonial Hills with white-collar families.
Modern era (post-1965)
The 1965 Hart-Cellar Act opened the door to new immigration, but Lincoln’s foreign-born share remained low compared to the national average. The most significant post-1965 change was the growth of the Hispanic population, which now stands at 8.8%. This community began forming in the 1970s and 1980s, driven by agricultural and meatpacking jobs in nearby towns, and later by construction and service work in Lincoln itself. The South Salt Creek neighborhood and parts of Near South became the primary entry points for Hispanic families, with small businesses and Spanish-language churches emerging along South 11th Street. The East/Southeast Asian population (3.8%) grew more recently, largely through UNL’s graduate programs and refugee resettlement programs. Vietnamese and Chinese families concentrated in the East Campus area and the Highlands neighborhood, drawn by affordable housing and proximity to the university. The Indian-subcontinent population (0.7%) is smaller but highly educated, with many professionals working at UNL or Bryan Health, and they tend to settle in newer subdivisions in southwest Lincoln. The Black population (4.1%) has remained relatively stable, with a historic presence in the Near South and Belmont neighborhoods dating to the Great Migration, though recent growth has been modest. Suburbanization accelerated after 1990, with white and middle-class families moving to the Southwest and Northwest quadrants, leaving older core neighborhoods more diverse by income and ethnicity.
The future
Lincoln’s population is projected to grow to roughly 350,000 by 2040, driven by natural increase and domestic migration from higher-cost states like California and Colorado. The city is not tribalizing into stark ethnic enclaves, but distinct patterns are emerging: Hispanic families are spreading from South Salt Creek into the Southwest and Foster Park areas, while East/Southeast Asian communities remain concentrated near the university. The white share is declining slowly (from 82% in 2010 to 77.2% today), and the foreign-born share is rising but will likely plateau below 10% due to Nebraska’s relatively restrictive state-level immigration policies. The Indian-subcontinent population is growing fastest in percentage terms, but from a very small base, and its members are highly assimilated into professional and academic circles. The next 10-20 years will likely see Lincoln become slightly more diverse, but it will remain a predominantly white, college-educated city with a stable, family-oriented culture. The biggest demographic change may be internal: the aging of the baby-boom generation in established neighborhoods like Colonial Hills and Eastridge, and the influx of younger families into infill developments near downtown and the university.
For someone moving to Lincoln now, the city offers a population that is stable, educated, and increasingly varied by ethnicity, but still defined by its Midwestern roots and government-university anchor. The neighborhoods where you settle will shape your experience more than the city’s overall demographics, with older core areas offering diversity and walkability, and newer suburbs providing homogeneity and space. Lincoln is becoming a slightly more diverse version of its past, not a radically different place.
* Values derived from national, state, county, city and local statistics and may differ in a specific area. Last updated: 2026-04-15T23:39:09.000Z
Narrative content on this page is AI-generated and may contain mistakes. Verify any details that matter before acting on them.
ReloMaps may earn a commission from affiliate links at no extra cost to you.