
Photo: Wikipedia
Quality of Life in Long Beach, CA
Above-average quality of iife. The area offers a reasonable cost of living, decent mobility, and a mix of neighborhood amenities.
What does Quality of Life tell us?
Quality of Life blends cost of living, nearby amenities, socioeconomic signals, and neighborhood character. City-level scores represent the whole municipality; individual neighborhoods can differ.
What does this tell us?
Quality of Life blends cost of living, nearby amenities, socioeconomic signals, and neighborhood character. City-level scores represent the whole municipality; individual neighborhoods can differ.
Cost of Living
101% above national average
The Real Cost of Living in Long Beach, CA for 2026
| Tier | Individual | Family (4) |
|---|---|---|
| Survival | $29k | $54k |
| Comfortable | $102k | $150k |
| Luxury | $149k+ | $232k+ |
| Elite (Top 5%) | $176k+ | $273k+ |
56%
The Area Signal
A metric tracking the socioeconomic signals of the area.
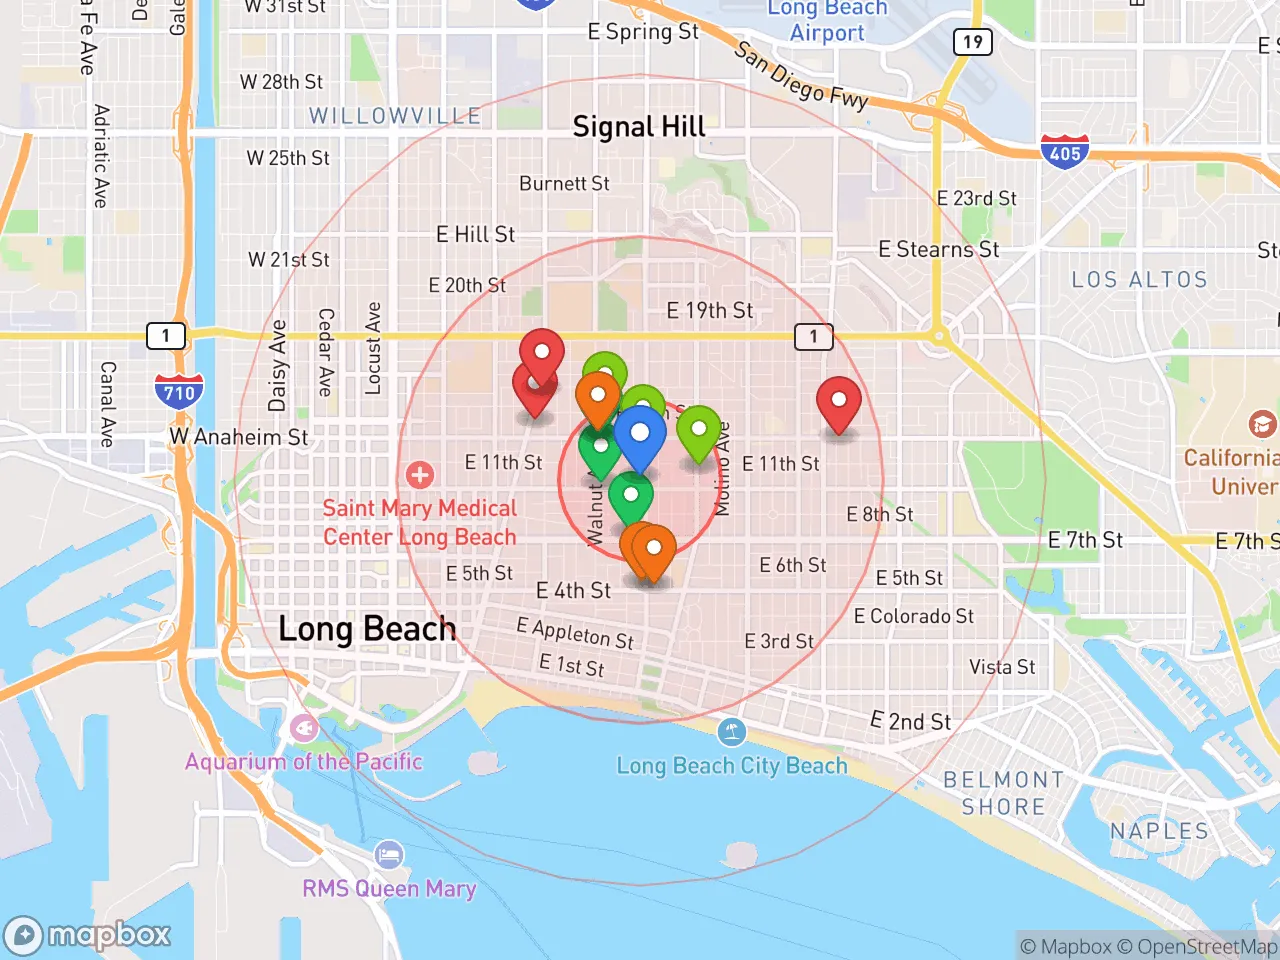
Hobbies
Explore the areaGroceries
0 within 10 miles
Gas
0 within 10 miles
Hospital
0 within 20 miles
Airport
LAX — Los Angeles International
Post Office
Critical Amenities
Quality-of-Life Analysis
Long Beach, California, presents a quality-of-life profile that blends coastal affluence with working-class diversity, attracting a mix of young professionals, established families, and creative-class renters. With a cost-of-living index of 201—double the national average—the city demands a premium for its oceanfront location and proximity to Los Angeles, yet it remains more affordable than neighboring beach communities like Santa Monica or Manhattan Beach. The typical resident is a renter in their 30s or 40s, often commuting to jobs in the broader LA metro, drawn by Long Beach’s distinct identity as a self-contained urban center with its own port, airport, and cultural scene.
Cost of living, housing costs, and how Long Beach compares to nearby cities
Long Beach’s cost of living is 101% above the U.S. average, driven primarily by housing. The median home value sits at $762,200, which is roughly $200,000 less than the Los Angeles County median and significantly below the $1.5 million-plus averages in Santa Monica or Newport Beach. For renters, the median monthly rent of $1,803 is a relative bargain compared to the $2,500+ typical in coastal Orange County or West LA, though it still consumes a large share of income for most households. The average commute of 30 minutes is shorter than the LA metro average of 35 minutes, thanks to Long Beach’s dense job base in healthcare, logistics, and the port. Property taxes are capped at roughly 1.1% of assessed value under Proposition 13, but state income taxes (up to 13.3%) and high sales tax (10.25%) add to the overall burden. Compared to inland suburbs like Lakewood or Cerritos, Long Beach offers more walkable neighborhoods and beach access but at a 15-20% housing premium.
What daily life is like for families: schools, parks, and neighborhood amenities
Daily life in Long Beach revolves around its distinct neighborhoods—from the historic Craftsman homes of Belmont Heights to the waterfront high-rises of Downtown and the family-oriented enclaves of Bixby Knolls. The Long Beach Unified School District serves over 70,000 students and includes several high-performing magnet schools, such as Woodrow Wilson Classical High School and California Academy of Mathematics and Science, though overall district ratings vary widely by neighborhood. The city maintains over 50 parks, including the sprawling El Dorado Regional Park with its nature center and golf course, and the 3.1-mile beachfront bike path along the Pacific. For families, the Aquarium of the Pacific, the Queen Mary, and the annual Grand Prix provide year-round attractions. The restaurant scene is notably diverse, with a strong Cambodian and Mexican food presence along Anaheim Street and a growing craft brewery corridor in the East Village Arts District. Walkability is highest in the 90803 and 90804 zip codes, while car dependency remains the norm in North Long Beach and the Wrigley area.
Long Beach is best suited for those who value urban coastal living without the extreme price tag of Santa Monica or Venice, and who can tolerate trade-offs in school quality and public safety for access to a working port city with genuine character. Young professionals and dual-income families with a combined household income above $120,000 will find the housing market manageable, while single renters earning under $60,000 may struggle with the rent-to-income ratio. The city’s progressive politics, strong LGBTQ+ community, and transit connections via the Blue Line light rail make it a natural fit for creatives and commuters who want beach proximity without the LA traffic nightmare. For those seeking a quieter, more suburban lifestyle with top-tier schools, the nearby cities of Seal Beach or Rossmoor may be a better fit.
Crime in Long Beach, CA
WARNING: The crime statistics are unreliable for this jurisdiction. Local authorities have either not reported or under reported their data to the FBI. This could be due to bad intentions, incompetence or technical issues. Regardless, we suggest skepticism.
Significantly higher crime rates than 83% of comparable U.S. locations.
Violent CrimeViolent Crime Analysis
Property CrimeProperty Crime Analysis
Crime Analysis
Long Beach, California, presents a challenging safety landscape, with violent crime rates significantly exceeding both state and national averages. The city recorded a violent crime rate of 620.8 incidents per 100,000 residents, while property crime stood at 2,552.8 per 100,000. These figures place Long Beach in a higher-risk category for a major West Coast port city, a reality shaped by both socioeconomic factors and local criminal justice policies.
Crime in context
Long Beach’s violent crime rate is roughly 1.6 times higher than the California state average and approximately 1.7 times the national average. Property crime, while elevated, is closer to the state norm but still exceeds the national median. The city’s proximity to Los Angeles and its status as a major transportation hub contribute to these numbers, but local policy choices also play a role. Los Angeles County, which includes Long Beach, has elected progressive district attorneys and judges who have implemented policies such as reduced cash bail, sentence reductions, and diversion programs for repeat offenders. While these measures aim to reduce incarceration, critics argue they have directly increased recidivism and emboldened property and street-level crime, as offenders face minimal consequences for non-violent and even some violent offenses.
What residents experience
For residents, the high property crime rate—2,552.8 per 100,000—translates into frequent vehicle break-ins, package thefts, and burglaries, particularly in areas near transit corridors and commercial districts. Violent crime, though less common, is concentrated in specific neighborhoods and often involves gang-related activity or robberies. The practical impact is that many Long Beach residents invest in security systems, avoid walking alone after dark in certain areas, and remain vigilant about locking cars and homes. The city’s police department has struggled with staffing shortages, and response times for non-emergency property crimes can be slow, further eroding public confidence in the justice system.
Neighborhood-level variation is significant. Areas like Belmont Shore, Naples, and Bixby Knolls report lower crime rates and a stronger sense of safety, with active neighborhood watches and higher property values. In contrast, West Long Beach, North Long Beach, and parts of Central Long Beach experience higher concentrations of violent crime and property offenses. Prospective residents should research specific zip codes and block-level data, as safety can change dramatically within a few blocks. Overall, while Long Beach offers coastal amenities and cultural diversity, its crime statistics and the lenient justice environment in Los Angeles County warrant serious consideration for anyone prioritizing personal and property safety.
* Values derived from national, state, county, city and local statistics and may differ in a specific area. Last updated: 2026-04-24T11:52:30.000Z
Narrative content on this page is AI-generated and may contain mistakes. Verify any details that matter before acting on them.
ReloMaps may earn a commission from affiliate links at no extra cost to you.