Photo: Wikipedia
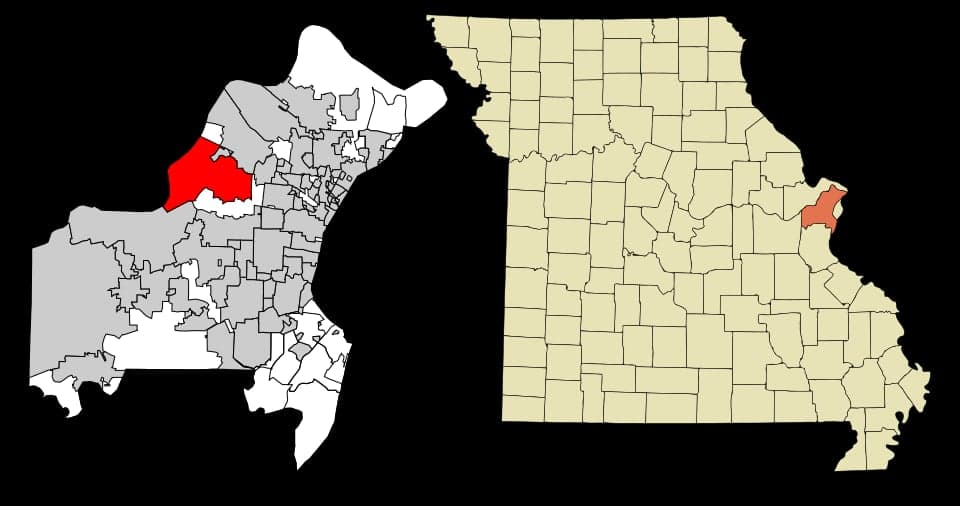
Demographics of Maryland Heights, MO
Affluence Level in Maryland Heights, MO
An upper-middle-class area. Household wealth, education levels, and homeownership run ahead of national benchmarks.
People of Maryland Heights, MO
Maryland Heights, Missouri, is a dense, diverse inner-ring suburb of St. Louis where nearly one in three residents was born outside the United States, a figure that sharply distinguishes it from the surrounding region. With a population of 27,981, the city is characterized by a significant Indian-subcontinent community (16.5% of residents), a substantial Black population (14.0%), and a smaller East/Southeast Asian presence (2.6%), all layered over a white majority that has shrunk to 57.3%. The city’s identity is less a melting pot and more a collection of distinct residential enclaves, each shaped by a specific wave of migration tied to the area’s industrial and corporate anchors.
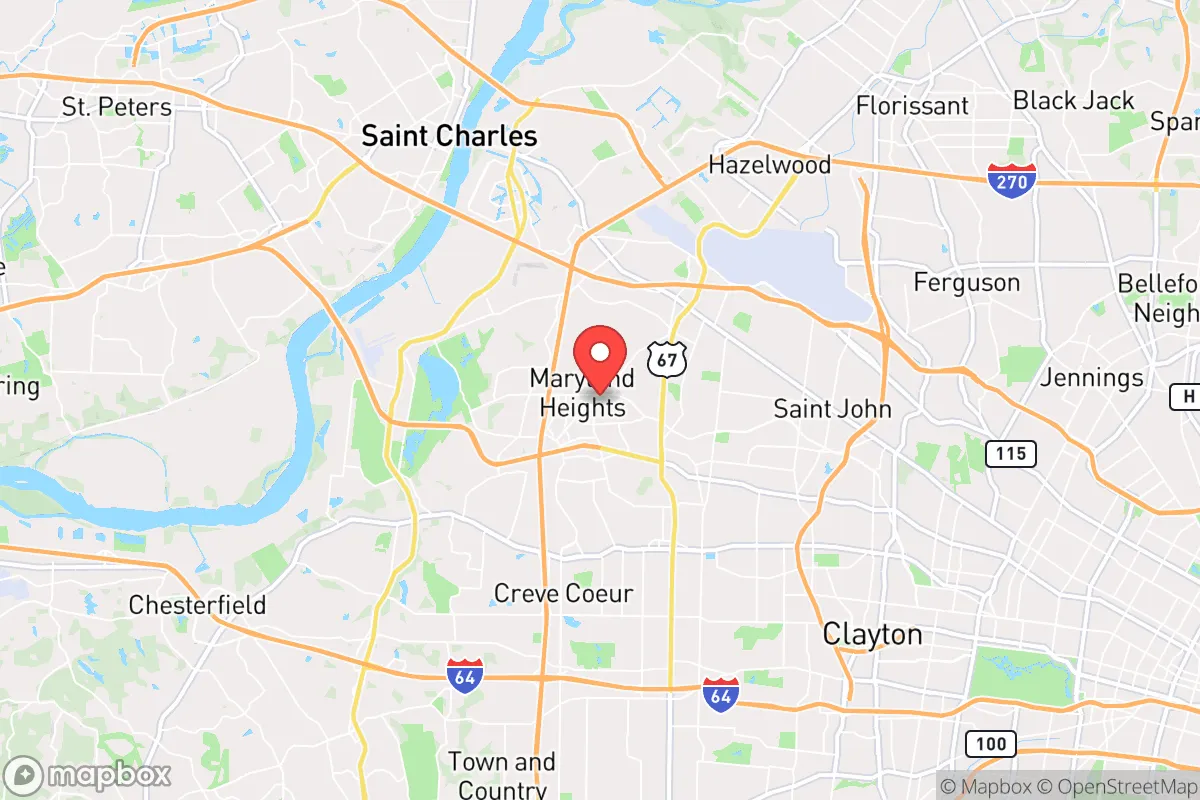
How the city was settled and grew
Maryland Heights was not a pioneer settlement. The area remained sparsely populated farmland through the 19th century, with the first real growth triggered by the arrival of the Missouri Pacific Railroad in the 1850s. The city’s name derives from a land grant to the Maryland Colony, but the first significant population wave came during the post-World War II suburban boom. Between 1950 and 1970, the construction of Interstate 270 and the expansion of McDonnell Douglas (later Boeing) in nearby Berkeley drew white working- and middle-class families from St. Louis city and the surrounding rural counties. These families settled into the first planned subdivisions: Woodlands and Westport, both built in the 1960s as single-family-home neighborhoods with large lots and access to the new highway network. By 1970, Maryland Heights was a nearly all-white bedroom suburb of about 10,000 people.
Modern era (post-1965)
The 1965 Hart-Cellar Act reshaped the city’s demographics, but the effect was delayed until the 1980s and 1990s. The key catalyst was the expansion of corporate campuses along the I-270 corridor, particularly Express Scripts (now part of Cigna) and the Monsanto research facilities. These employers actively recruited skilled professionals from India, creating the first major non-white wave. Indian families concentrated in the Village of Westport and the newer Hunters Ridge subdivisions, drawn by good schools in the Pattonville School District and proximity to the tech and pharmaceutical jobs. By 2000, the Indian-subcontinent population had reached roughly 8% of the city’s total, and it has since doubled to 16.5%.
Domestic in-migration also shifted. The 1990s and 2000s saw Black families move from north St. Louis County and the city of St. Louis into Maryland Heights, particularly into the Briarcliff and Westwood neighborhoods, where older, more affordable housing stock offered a suburban alternative to the declining urban core. The Black population rose from under 5% in 1990 to 14.0% today. East/Southeast Asian communities, primarily Vietnamese and Chinese, arrived more gradually, settling in the Westport Plaza apartment complexes and the Deer Creek area, often working in the service and hospitality sectors tied to the Westport entertainment district. The white population, meanwhile, has aged and declined in absolute numbers, dropping from over 80% in 1990 to 57.3% today, as younger white families have moved farther west to St. Charles County.
The future
The population trajectory points toward continued diversification, but with a notable tribalization into distinct enclaves rather than wholesale integration. The Indian-subcontinent community is the fastest-growing segment, driven by both professional recruitment and chain migration; it is projected to reach 20-22% of the population by 2035, with new arrivals concentrating in Hunters Ridge and the newer Bellerive Acres subdivisions. The Black population has plateaued since 2010, as housing prices in Briarcliff and Westwood have risen, reducing affordability for new in-movers. The East/Southeast Asian community remains small and stable, with little new immigration from those regions. The white population will continue to shrink slowly, but the city is unlikely to become majority-minority within the next decade, as the white share is still above 57% and the overall population is not growing rapidly (the city added only about 1,200 people between 2010 and 2020).
The most significant unknown is the fate of the Westport commercial district, which has seen declining office occupancy post-2020. If major employers like Cigna reduce their local footprint, the professional Indian migration could slow, shifting the demographic driver toward family reunification and small-business ownership instead. Conversely, if the area attracts new biotech or logistics firms, the Indian and East/Southeast Asian populations could both see renewed growth.
For a conservative-leaning individual or family considering a move, Maryland Heights offers a stable, suburban environment with strong schools and a tax base supported by corporate headquarters, but it is not a culturally homogeneous community. The city is becoming a patchwork of distinct ethnic neighborhoods, each with its own institutions and social networks. The practical implication is that newcomers will find a place that values property rights and local schools but where the public square is increasingly shaped by multiple, separate communities rather than a single dominant culture. This is a suburb that has absorbed diversity without fully integrating it, and that pattern is likely to persist for the next generation.
* Values derived from national, state, county, city and local statistics and may differ in a specific area. Last updated: 2026-04-19T10:38:39.000Z
Narrative content on this page is AI-generated and may contain mistakes. Verify any details that matter before acting on them.
ReloMaps may earn a commission from affiliate links at no extra cost to you.