Photo: Wikipedia
Demographics of Montauk, NY
Affluence Level in Montauk, NY
A wealthy area with high-earning, well-educated households. Incomes, home values, and educational attainment meaningfully outpace national averages.
People of Montauk, NY
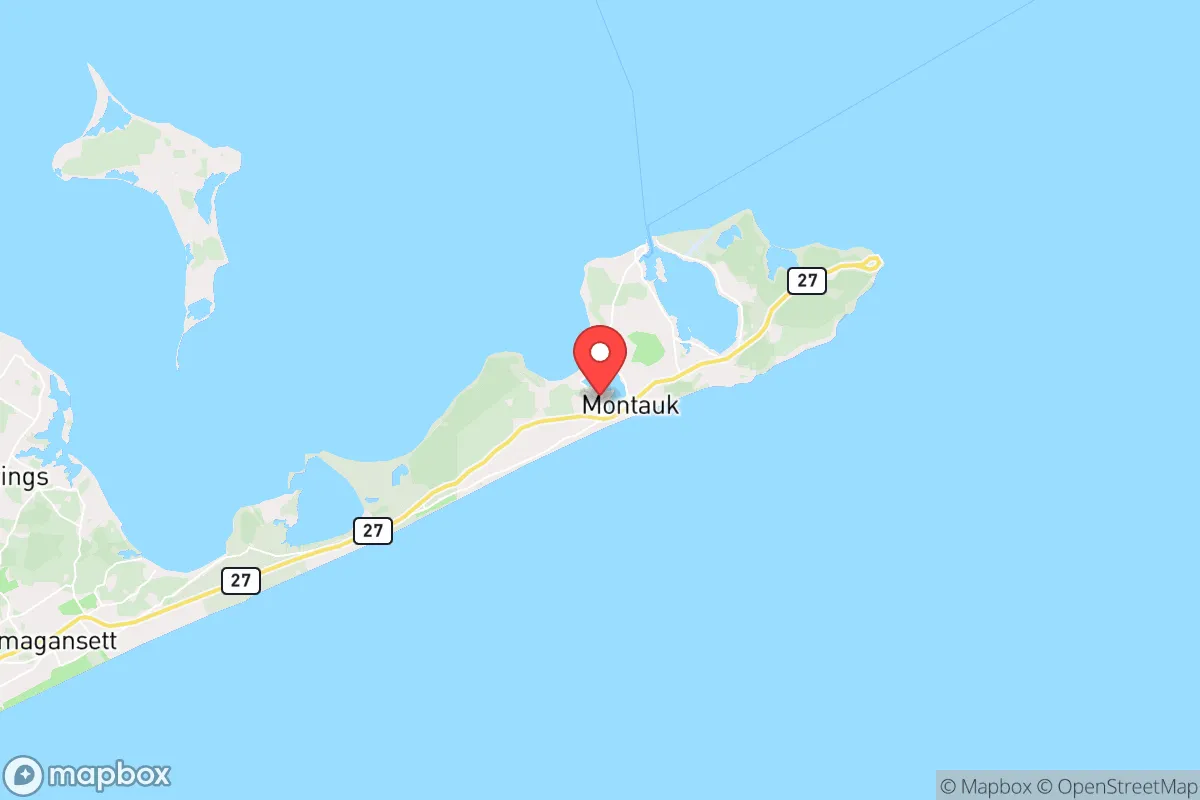
Montauk, New York, is a tightly-knit coastal community of 4,073 residents, characterized by its overwhelmingly white (89.1%) and native-born (94.9%) population. With nearly half of adults holding a college degree (48.9%), the village has a distinctly professional and affluent character, shaped by its history as a fishing village turned summer colony. The population is notably homogenous compared to the rest of Suffolk County, with a small Hispanic minority (6.4%) and negligible Black (1.2%) or Asian (0.0%) presence, reflecting a community that has seen limited demographic diversification over the past half-century.
How the city was settled and grew
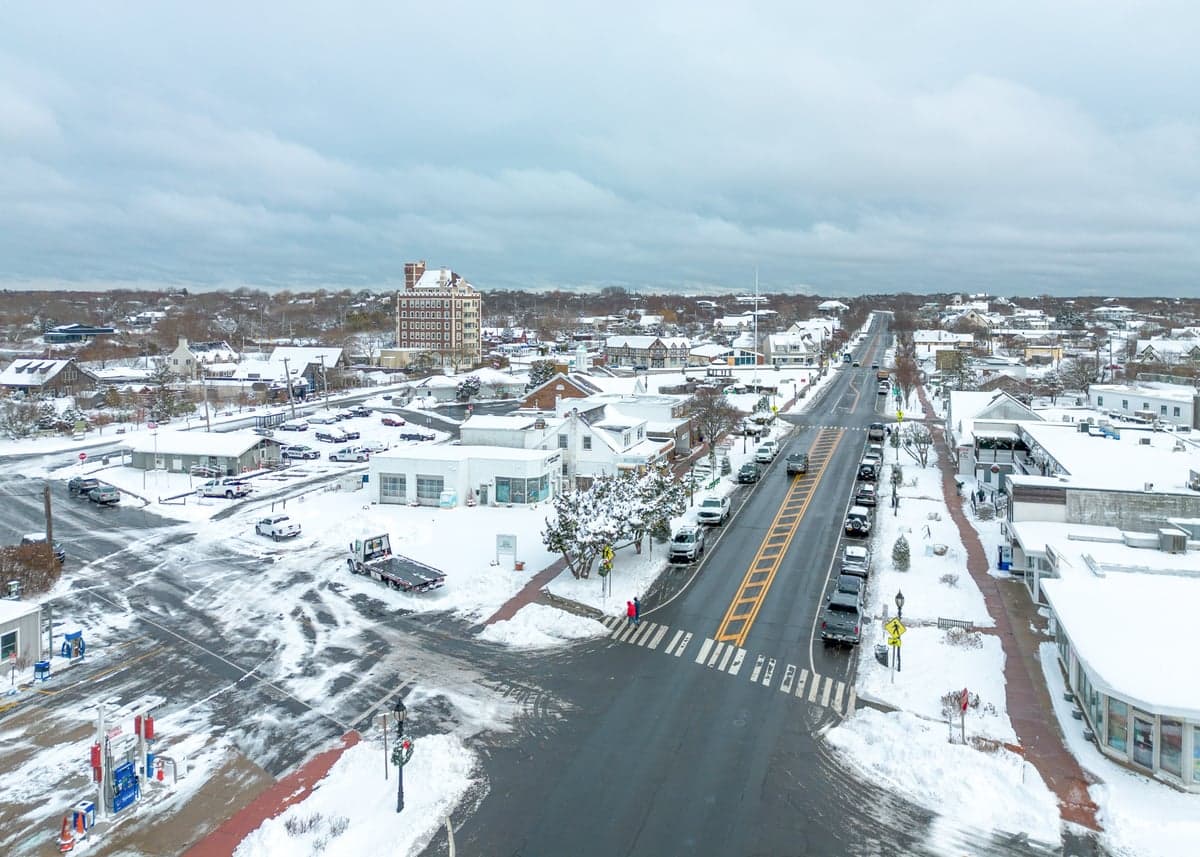
Montauk’s human history begins with the Montaukett people, an Algonquian-speaking tribe who used the eastern end of Long Island as seasonal fishing and whaling grounds. European settlement began in earnest in the mid-17th century when the land was purchased by settlers from East Hampton, but the area remained sparsely populated ranchland for nearly 200 years. The first major wave of permanent residents arrived in the mid-19th century, drawn by the establishment of the Montauk Point Lighthouse (1797) and the rise of commercial fishing and whaling. These early families—many of English and Scottish descent—built homes in what is now Fort Pond Bay and along the Montauk Harbor area, creating a working waterfront community. The arrival of the Long Island Rail Road in 1895 transformed the village, turning it into a destination for wealthy sportsmen and vacationers. The Montauk Association, a planned summer colony of shingle-style cottages designed by Stanford White, was built in the 1880s on the bluffs overlooking the Atlantic, attracting a seasonal elite from New York City. By the early 20th century, the village had a dual character: a year-round fishing population clustered near the harbor and a summer population of affluent families in the Hither Hills and Ditch Plains areas.
Modern era (post-1965)
After the 1965 Immigration and Nationality Act, Montauk did not experience the large-scale immigration that reshaped many other parts of New York. The village’s remote location at the tip of Long Island, combined with high property values and strict zoning, limited new housing construction and kept population growth minimal. The year-round population actually declined from a peak of roughly 5,000 in the 1970s to around 4,000 today, as fishing and maritime industries contracted. The Hispanic population, now 6.4%, began arriving in the 1980s and 1990s, primarily as service workers in the hospitality and landscaping sectors. These families settled in more affordable pockets, particularly around Edgemere Street and the Montauk Highway corridor near the village center, where rental apartments and older homes provided entry points. The Black population, historically small, has remained below 2% since 1990, concentrated in a few multi-generational families in the Lake Montauk area. The Asian population (East/Southeast Asian) is effectively zero, and there is no measurable Indian-subcontinent community. The white population, while still dominant, has shifted from a mix of fishing families and summer residents to a more uniformly affluent demographic, as second-home buyers and remote workers have priced out many working-class year-rounders. The Downtown Montauk area, once a mix of bars and fish markets, now features boutique hotels and upscale restaurants catering to tourists.
The future
Montauk’s population is likely to continue its slow decline or stagnation, with the year-round count remaining between 3,500 and 4,200 through 2040. The village is homogenizing rather than diversifying: the white share is projected to stay above 85%, as high housing costs (median home value over $1.5 million) block most new immigrant settlement. The Hispanic population may grow modestly to 8-10% as service-sector workers continue to find rental housing in the Edgemere Street and Industrial Road areas, but these families face increasing displacement pressure from short-term rentals and second-home conversions. The Black and Asian populations are expected to remain negligible, as there are no major employers or institutions drawing these groups. The community is tribalizing into two distinct enclaves: a wealthy, mostly white seasonal population concentrated in Hither Hills and Ditch Plains, and a smaller, more diverse year-round workforce living in the village core and around Lake Montauk. The next decade will likely see continued tension between preservationist year-rounders and the tourism-driven economy, with demographic change coming slowly, if at all.
For a conservative-leaning individual or family considering a move, Montauk offers a stable, safe, and overwhelmingly native-born community with strong property rights and a traditional small-town character. The trade-off is high cost, limited ethnic diversity, and a seasonal economy that can feel empty in winter and overcrowded in summer. This is a place where the population is not growing or diversifying—it is consolidating around an affluent, white, college-educated core, making it a predictable but expensive choice for those who value homogeneity and coastal living over demographic change.
* Values derived from national, state, county, city and local statistics and may differ in a specific area. Last updated: 2026-04-24T01:47:24.000Z
Narrative content on this page is AI-generated and may contain mistakes. Verify any details that matter before acting on them.
ReloMaps may earn a commission from affiliate links at no extra cost to you.